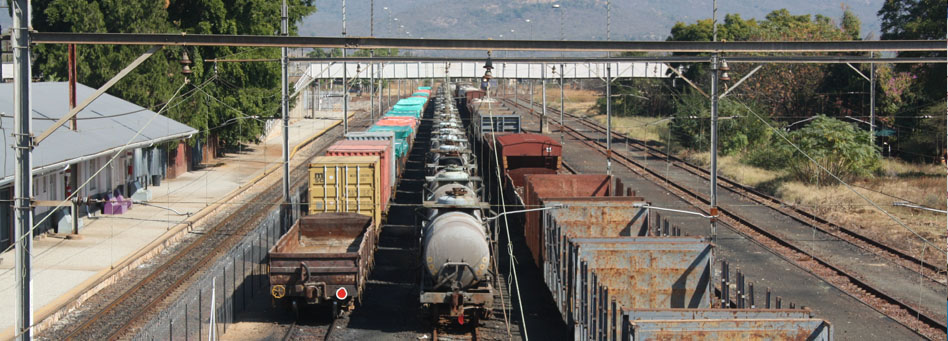
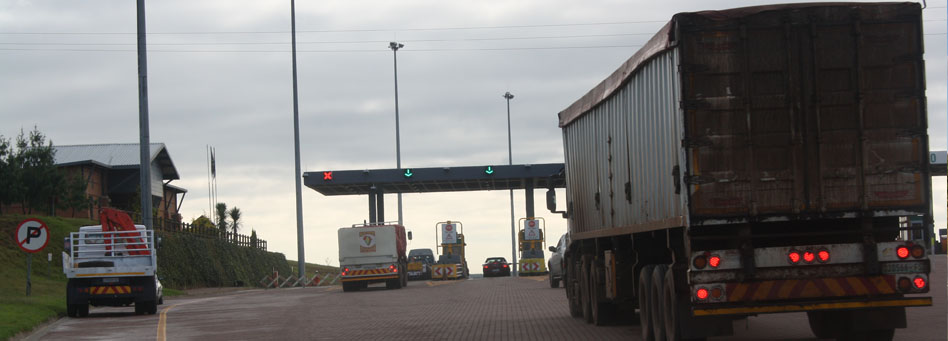
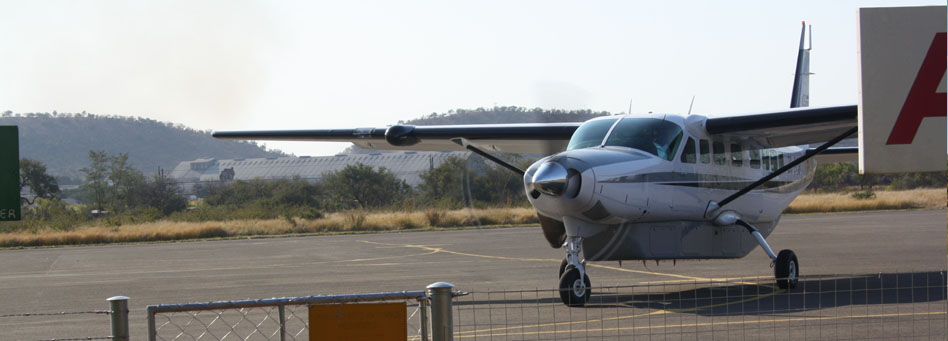

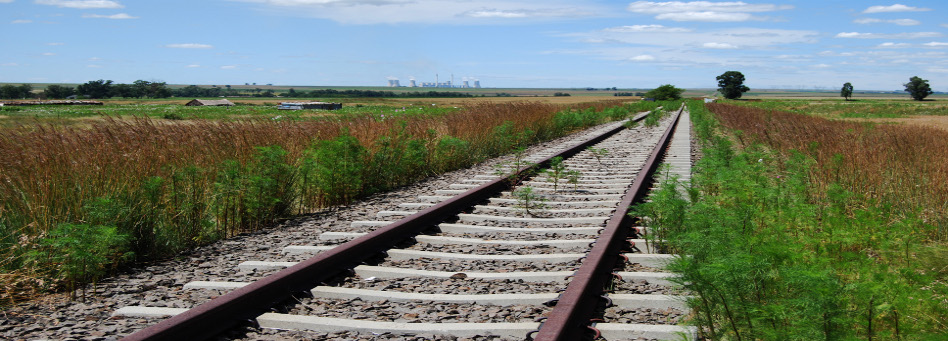
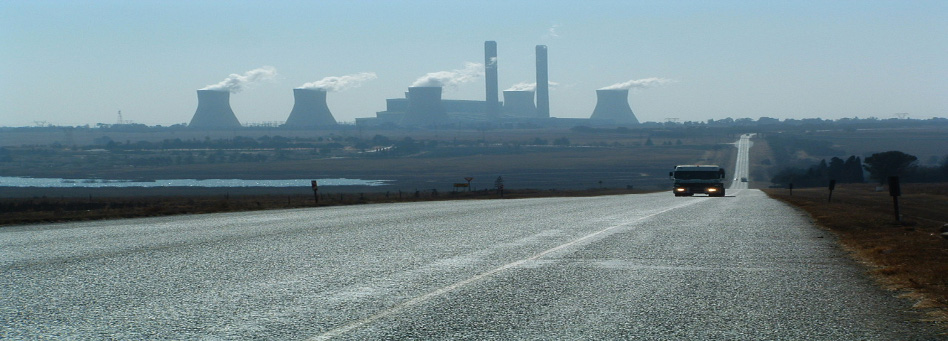

Currently, road transport is the most used mode of transport in Mpumalanga. This is in line with the country's trend. According to the State of Logistics Survey for South Africa, 2008, road freight constitutes 87% of all freight movement in the country, whilst the remaining is associated with other modes (12% with rail, 0,08% with air, 0.29% with coastal shipping, and 0.69% with pipelines). The choice of road as a means of freight transport is influenced in some instances by: reliability of mode, time to reach destination, safety of goods, and ease of access to collection or delivery points.
Road freight traffic surveys were conducted so as to ascertain the following information per route:
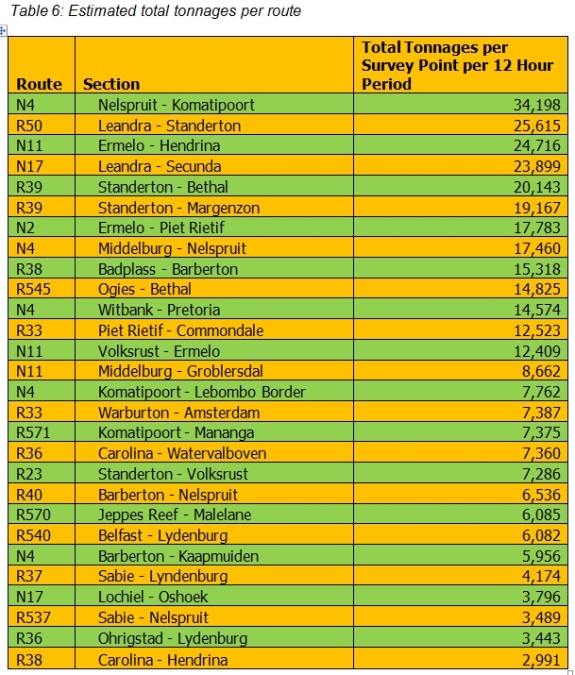
- Volume of freight traffic flow
- Commodity type
- Vehicle type
- Trailer type
- Weight estimate
- Origin and destination
The routes that were surveyed, including the survey point coordinates are given in Table 1


The volumes were collected within a twelve hour period (6 am - 6 pm) per survey point. The information thus gives us a snap shot view of the route activity, as opposed to the actual activities. Together with assumptions made, the snapshot information is used to infer on the annual route activity.
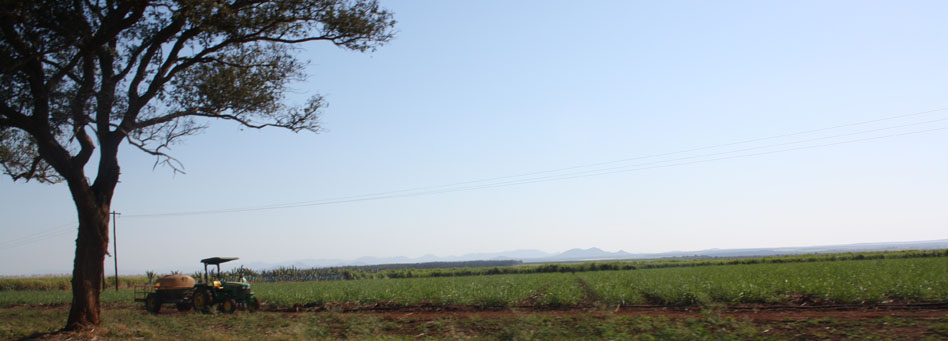
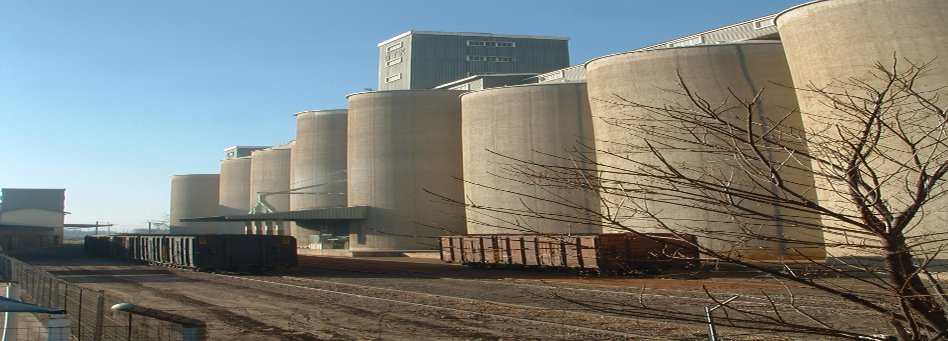
Commodities are classified and named as shown in Table 3. The commodities were physically identified as the cargo moved through the survey point.

Vehicle types are classified and named as shown in Table 4. The vehicle types were physically identified as the cargo moved through the survey point.

Trailer types are classified and named as shown in Table 5. The vehicle types were physically identified as the cargo moved through the survey point.

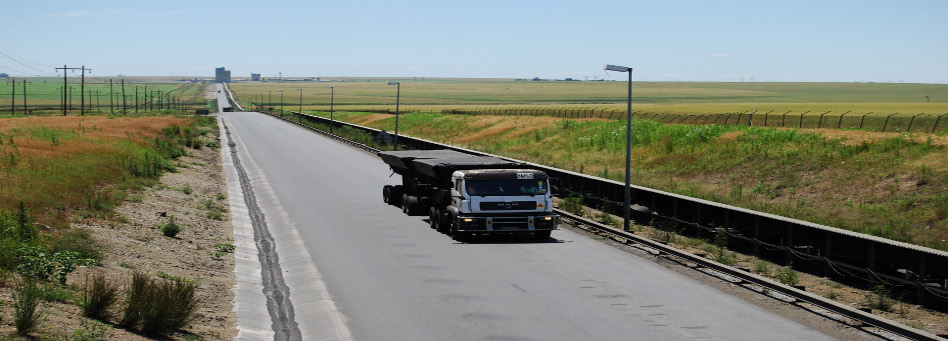
The heavy vehicles on South African roads are designed for specific functions and therefore have a wide range of different forms and configurations. The capacity of different configurations is defined by the number and location of the axles and the tare weight of the vehicle or combination. For the road surveys all Heavy Goods Vehicle [HGV] configurations utilised in South Africa are logically categorised into 5 different "Groups" that contain similar configurations in terms of carrying capacity.
In the software used to analyse the data each of the vehicle Groups is assigned a specified "average" payload. The assigned payload per Group has been calculated to take into account factors such as;
- The fact that a high proportion of industrial road cargoes "cube out" in volume before the load weight reaches the cargo truck (or combination) maximum permissible gross weight.
- There is a varying proportion of empty closed vehicles in the traffic stream, that effectively reduce the average load per vehicle.
- There is also potentially a proportion of overloaded vehicles in the traffic stream but from weighbridge observations, the actual weight of overloads is usually relatively small. The current percentage of overload trucks is at 26%.
A summary description of the roads is given in the tables below:


It is important to understand what drives freight movement. For every freight movement, there is an origin and a destination, and it is this information that helps us understand the freight behaviour environment. In Mpumalanga, three routes were identified for the Origin and Destination (O&D) survey. These routes are; the N4, N11, and N17. On the N4 route, the Middleburg weighbridges were used to conduct O&D surveys. The N11 and the N17 were both conducted on the Ermelo Traffic Control Centre, as freight moving on these routes is directed to the same centre.

From table 8, it can be observed that about 60% of freight movement within the Mpumalanga Province originates from the Mpumalanga Province, and about 20% originates from the Gauteng Province. About 60% of the total freight is destined within the province, whilst 16% and 11% are destined for Gauteng and KwaZulu Natal respectively.
Copyright © 2010 Mpumalanga Province Freight Transport Data Bank [ - ]
All rights reserved.
This website conforms to W3C Standard [ - ]