


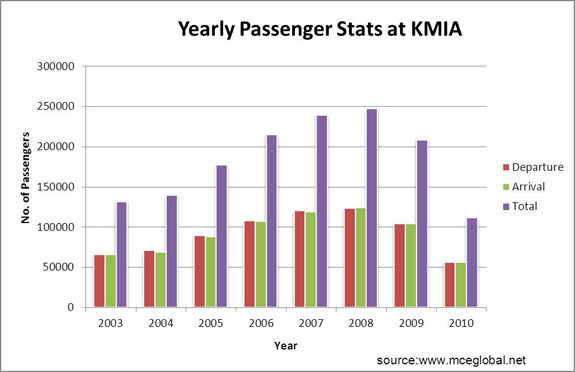
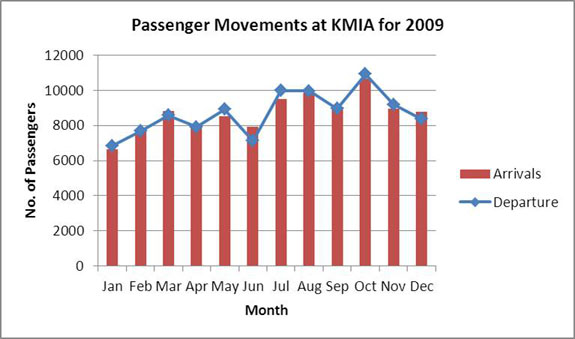
Yearly passenger numbers have been increasing since 2003 and climaxed in 2008. The year of 2009 saw a decline in passengers probably linked to the financial downturn which started in 2008. It will seem that the financial downturn which began in 2008 only filtered down to ordinary people the following year (2009) and as expected the first victim will be the tourism industry when people start to prioritise. Passenger statistics for the year 2010 is up until the month of June. It is interesting to note that the number of passengers departing and arriving in a year almost match, which is a sign of a tourist oriented users.

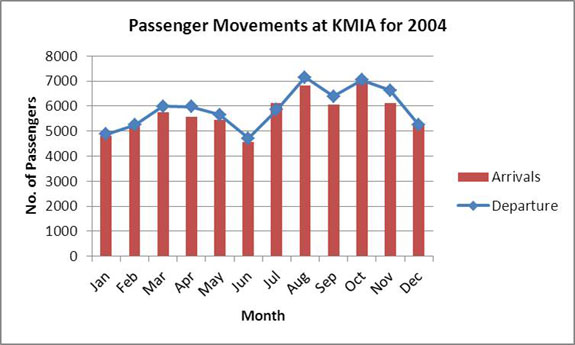
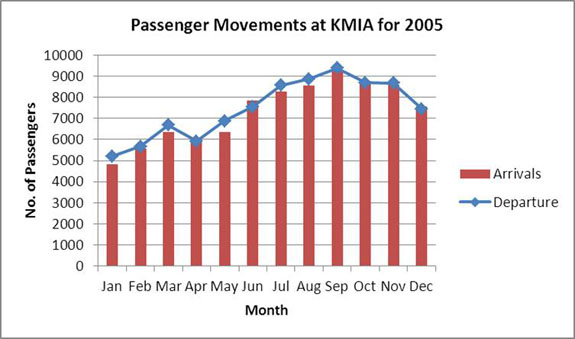
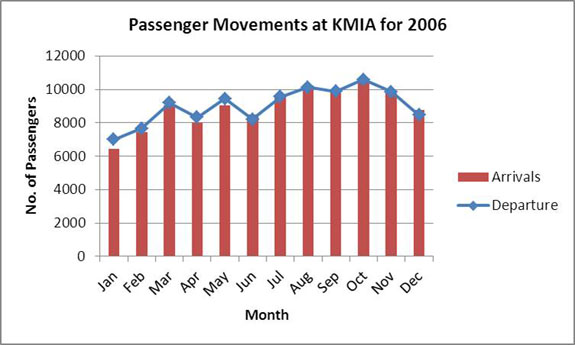
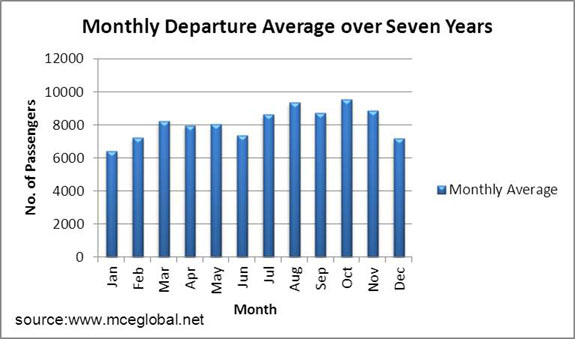
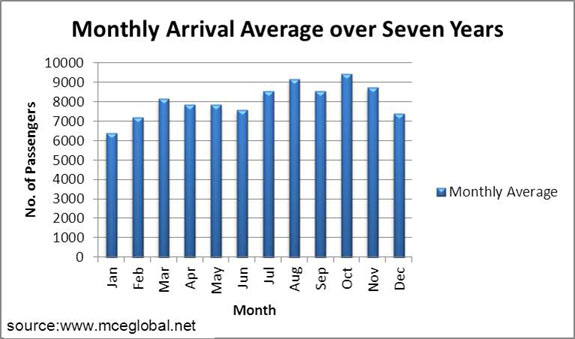
Below is presented monthly passenger statistics averaged over a seven year period (2003-2009). From the graphs shown in the previous section and below, it can be seen that the highest number of passenger movements occurs from the month of August to November.

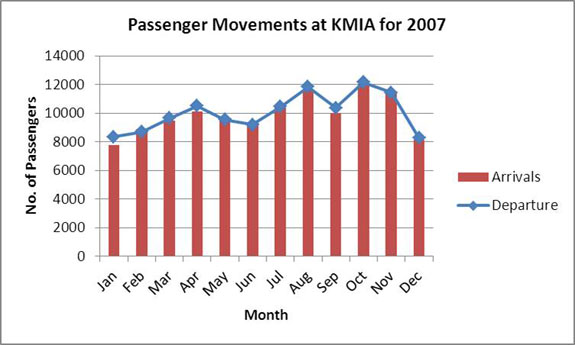
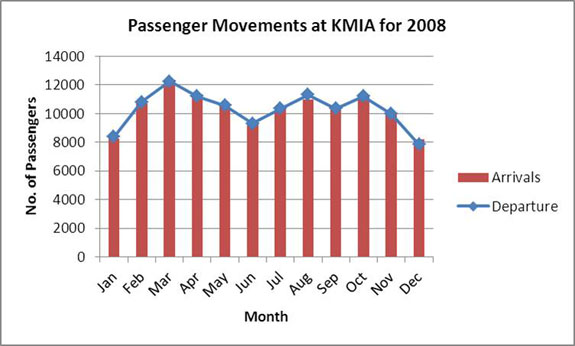
From the graphs shown below, it can be seen that the highest number of people arriving at KMIA occurs during the month of October. The monthly passenger arrival is well above 8%.

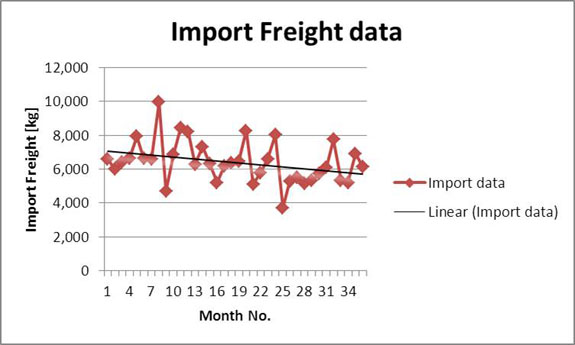
Air freight data for Kruger Mpumalanga International airport is presented in below from the year 2007 to the end of April 2010 for both import and export cargo. There has been a steady decline in imports since the year 2007 but exports although very low comparatively have been on the increase since 2007.
Kruger Mpumalanga airport averages 6.32 tonnes per months for imports and 1.96 tonnes per months for exports for the period under consideration.

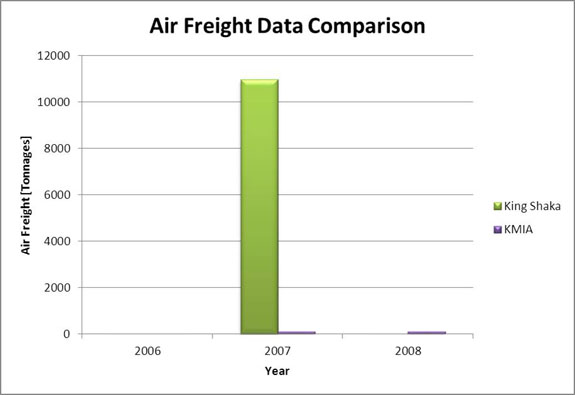
Air freight data for Durban International airport (now King Shaka) for the year 2007 is compared with data for KMIA for the period 2007-2008, and it can be clearly seen that air freight at KMIA is far lower. Not only is the freight at KMIA lower compared to King Shaka but also far lower compared to Cape Town and OR Tambo.
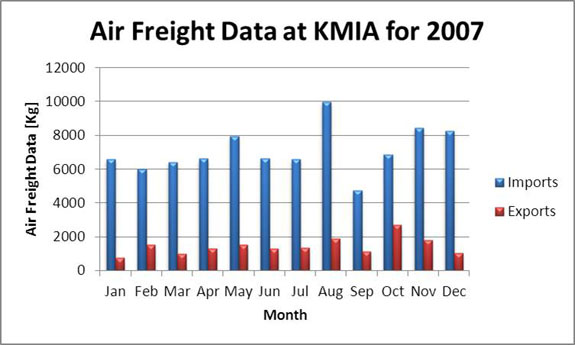
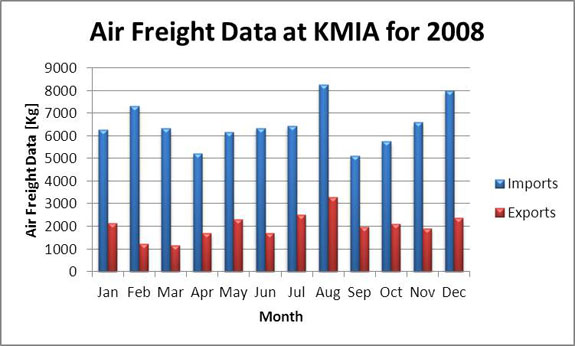
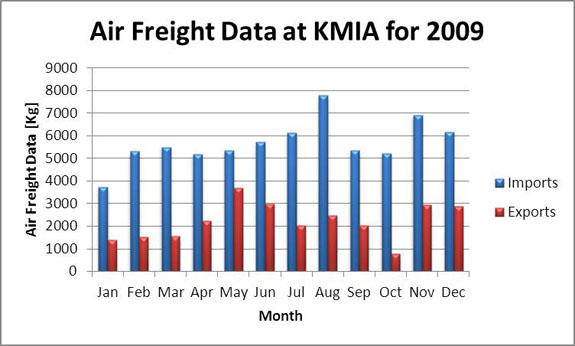
Air freight statistics at KMIA are presented below on a monthly basis from the year 2007-2009. It is interesting to notice that during the month of August there is a peak in imports which coincides with the peak for departing passengers, more on this subject is given below under "Freight and Passenger Comparison".
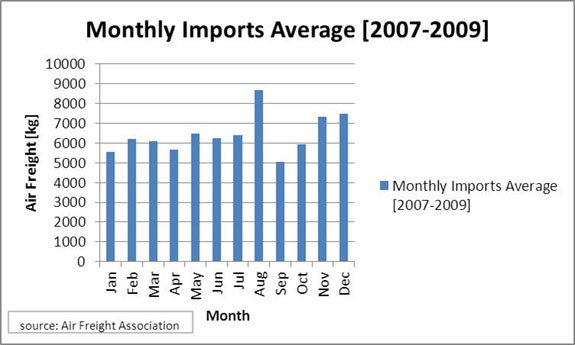
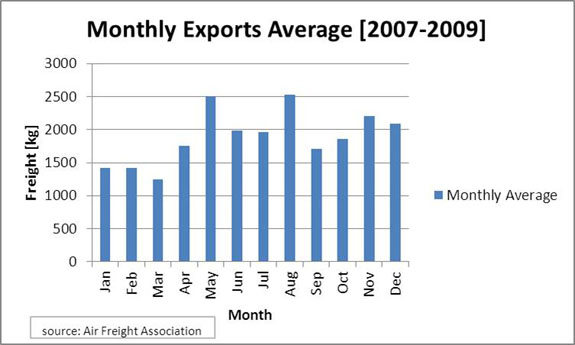
Annual air freight data averaged over a three year period (2007-2009) is presented below on a monthly basis. it is interesting to note that imports peak at 11% (of the total) in August while exports peak also at 11% but in May and August. Both imports and exports have a monthly average of 8.3% of the total for the period under consideration.


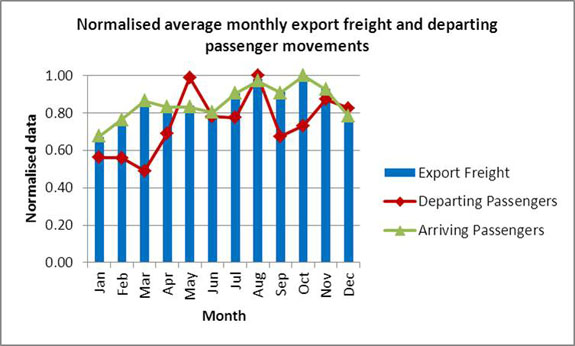
This section gives a comparison between passenger movements and frieght. The plots were created by taking a ratio between each value and the maximum value of each of the quantities under consideration. Normalising data in this manner makes it possible to make comparison between unlike quantities.
The first plot below confirms the saying that "freight follows passengers", import freight is always tracking passengers and peaking together during the month of August.
On the other hand export freight only tracks arriving passengers and mostly out of phase with departing passenger movements. The two plots below tells us wether freight follows passengers or not which it does in the top plot and only for arriving passengers on the bottom plot.

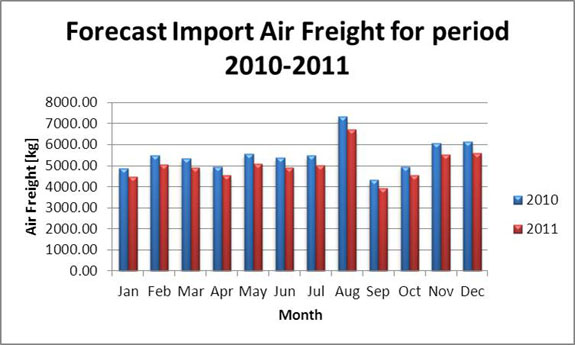
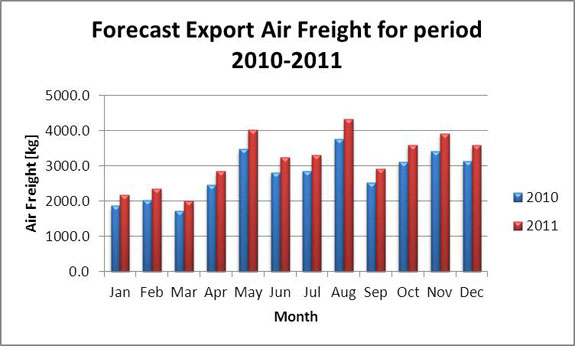
This section presents forecast import and export freight data at KMIA for the period 2010-2011. Although the request calls for atleast a five year forecast but due to limited historical data only a two year forecast will be practical. First historical data is presented and the trend studied.
Although import freight is much higher than export, it is following a declining trend as shown below which is a concern for the province. This general decline is possibly linked to the global financial downturn which started in 2008.
On the other hand, although export freight is much lower than import it is constantly on the increase which is positive for the province.

The import forecast predict a decline of around 3.5% for the year 2010 and a further decline of 11% in 2011 compared to the year 2009.
Exports are expected to rise by 25% in 2010 and a further rise of 45% in 2011 as compared to the year 2011.
Copyright © 2010 Mpumalanga Province Freight Transport Data Bank [ - ]
All rights reserved.
This website conforms to W3C Standard [ - ]