The first visitors were Portuguese sailors in the 14th Century, who christened this area Rios dos Peixes (the river of many fish). Not until 1879 did Richards Bay get its current name, when Rear-Admiral Sir Frederick William Richards arrived in his ship the HMS Forester to assist in the relief of Eshowe, and survey the coastline as an alternative to the port of Durban. In 1906, Zululand Fisheries was founded at Richards Bay, and in 1907 the first wagon track to Empangeni was established. The intent to build a port in Richards Bay was announced in 1965; and Parliament authorized construction of the new harbor May 1972, based on an agreement with the Transvaal Coal Owners Association to export 26 million tons of coal to the Far East over a 10 year period. The Port of Richards Bay was officially opened April 1st 1976.
From 1976, the development of the town of Richards Bay accelerated as a direct consequence of the construction of the Port and related heavy industries. The past three decades has seen the Port expand rapidly in both volume and diversity of cargoes handled, with the current handling capacity in excess of 100 million tons/annum.
The Port of Richards Bay found at Latitude 48 degrees 28 S and Longitude 32 degrees 02E; is located on the north eastern side of KwaZulu Natal (KZN) Province, 160 km from the Port of Durban consisting of bulk operations focusing on five primary land use and supportive use functions: Coal, Break-bulk, Dry-Bulk, Liquid Bulk, Multi-purpose and support facilities/port services ranging from mooring, port control, administrative functions and port authority activities. Further, the port caters for dry bulk vessels of 150, 000 DWT with the capability of deepening the basins and channels to handle 250, 000 DWT vessels. The entrance channel is wide (300m) and deep (22m) to accommodate vessels entering and leaving the Port simultaneously. Approximately 1,700 vessels are handled per annum.
The Port is the largest in South Africa, leading in terms of dry bulk volumes - with a total land and sea area of 2,174 and 1,443 hectares respectively . Only 70% of the land area has been developed and leased. The port handles a diverse group of commodities ranging from steel to forest products. As volumes of traffic have increased over the years so too has been the need to upgrade infrastructure and operations .
Diagram 6: Port of Richards Bay-Current Layout - Source: TNPA 2010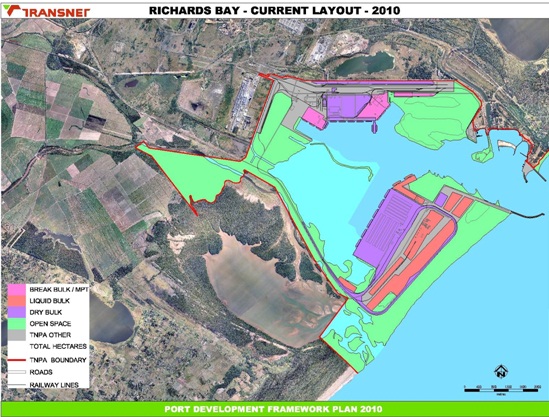
Landside
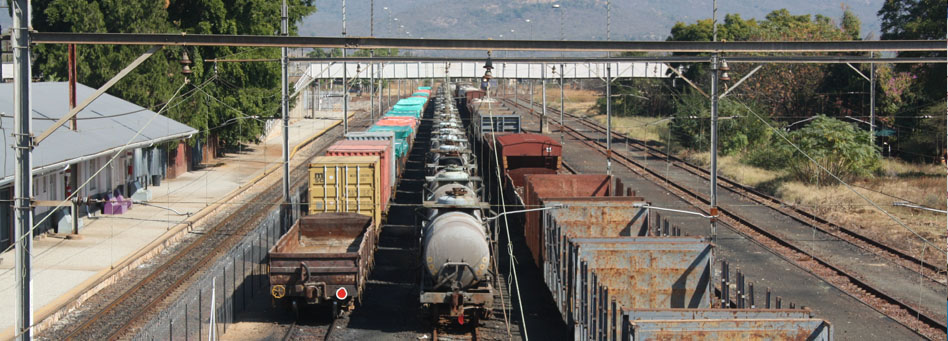
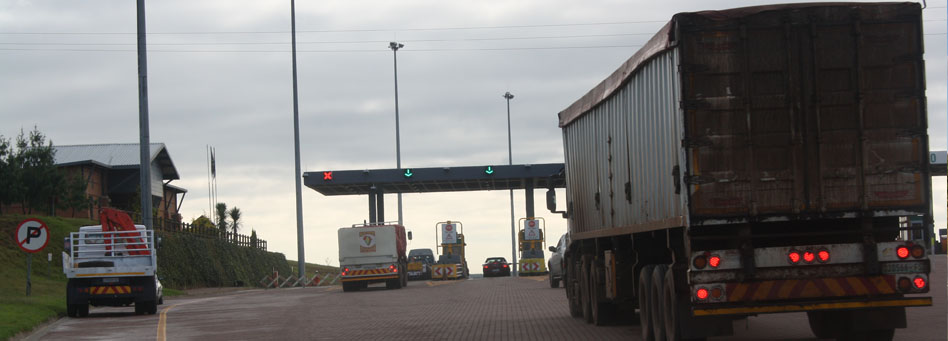
The port is served by road, rail, pipelines and conveyor networks. Rail is the dominant carrier of goods and caters for 88% of cargo handled by weight at the port. This is mainly due to the established existence of the bulk coal handled by the port via the COALlink. Road traffic is significant but restricted to the Multi-Purpose and Dry Bulk Terminals on the northern end of the port with mainly staff and general business traffic utilizing the road network to the coal terminal. In addition, conveyors link to neighboring industries such as Billiton Hillside, Foskor and Woodchip plants for dry bulk cargoes.
External and Internal Road Network
The external street network, which services the port directly, is summarized as follows:
- John Ross Highway (R34) - A Provincial main road is the main link between Richards Bay and Empangeni and links to the National Route (N2) for the Port and neighbouring industries.
- National Route 2- north-south link in KwaZulu Natal providing national and regional linkages.
- West Central Arterial- serves as the western entrance to the Port linking to Urania Road, the main access to the coal and liquid bulk terminals as well as to the Richards Bay CBD.
- Harbour Arterial- serves as an alternative link to the port from John Ross Highway and provides access to the Alusaf Bayside smelters.
- Medway Road- serves as the eastern entrance to the Port and serves the Multi-Purpose Terminals (Berths 701-708) including the Ferro and Timber storage areas.
- Bayview Boulevard- provides a third entry point into the Port serving the small crafts harbour and commercial developments on the eastern section of the Port.
Growth for the port continues to be in dry bulk cargo. However, coal has a definitive life span with volumes increasing steadily up to 2016/17 and decreasing after 2020 (at a rate of 2% per annum). With the exception of the multi-purpose terminal, the movement of cargo by road is relatively low. The predicted growth rates for this terminal are 2% per annum, and accommodated by the current road capacity (with the exception of John Ross Highway) within the 20 year planning horizon.
Internal Road Network
The internal road network is well developed given the number of berths served. The main routes are as follows:
- Newark Road: Main east-west collector/distributor consisting serving the Multi-Purpose and Dry Bulk Terminals; and the Port administration complex.
- Urania Road / Dune Road: Linking to the Richards Bay Coal Terminal and Island View bulk liquid storage areas.
- Medway Road: Parts of this route fall outside of the port boundary/ operational area and essentially serves as a link between Newark Road and John Ross Highway.
- Bridgetown Road: Together with Pioneer Road serve the small crafts harbour, Naval Island and commercial developments at the eastern end of the port.
- Ventura Road: Serves as the main link to the Port administration complex.
- Quayside Road: Unnamed road running between berths 701 to 708 and forms back of quay stack area.
- Tugela Road: Runs alongside the back of quay between berths 301 to 305 catering for service vehicles and links to the coal terminal administration area via Hardwick Road.
Rail Network
Total rail track at the port is 80 km. Rail forms an integral component to the ports logistic chain and accounts for approximately 88% of cargo movement by weight, and handled at the port. Most of this is coal, which accounts for 78% of the total tonnage throughput, although the Dry Bulk, Multi-Purpose and Liquid Bulk Terminals also have relatively high rail usage. The coal terminal is served by the dedicated coal line, which links the Port to the coal production areas in northern KwaZulu Natal and beyond. The link currently carries 72 million tons of coal per annum (mtpa) and Transnet Freight Rail (TFR) is currently investigating options to increase capacity to 86 mtpa to cater for anticipated increase in demand in the short term. Operated by COALINK, this is a subsidiary of Transnet Freight Rail (TFR). At the Coal Terminal the rail network is controlled by the Richards Bay Coal Terminal (RBCT) which is responsible for all expansions, improvements, maintenance and also for all shunting operations.
Waterside (Marine) Infrastructure
Part of the project scope involved the documentation of not only road/rail levels of service (LOS); but also marine/waterside infrastructure in terms of their capacity and parameters.
Port Parameters
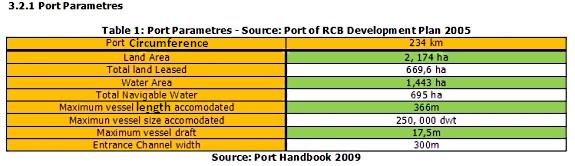
Table 1: Port Parameters - Source: Port of RCB Development Plan 2005
The Port provides pilotage and tug services on a 24-hour basis serving vessels on a first planned, first served basis. Richards Bay Coal Terminal Co. Ltd controls berth planning for coal vessels. The Port has Vessel Traffic System (VTS), which supplies relevant information to ensure the safe navigation of vessels through areas of high-density traffic, channels and port approaches. The VTS plays a significant role in the dissemination of information within the port and is the core of the information chain with the exchange of information linked by sub-systems to the wider port community.
Marine Infrastructure
The table below indicates berthing facilities available at the Port and other marine structures.
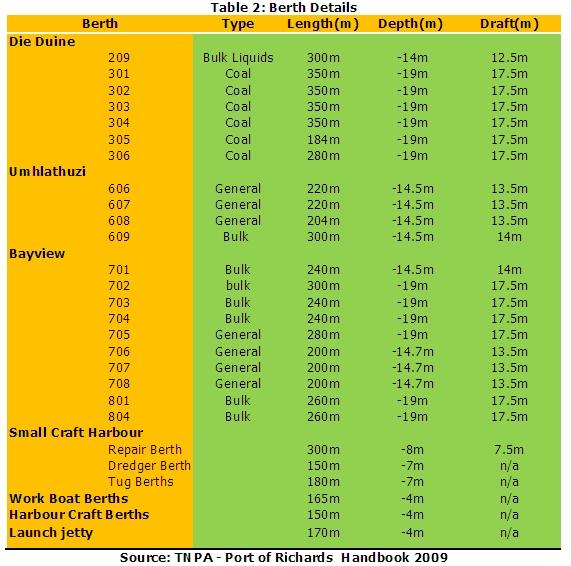
Table 2: Berth Details
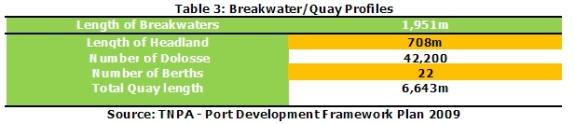
Table 3: Breakwater/Quay Profiles
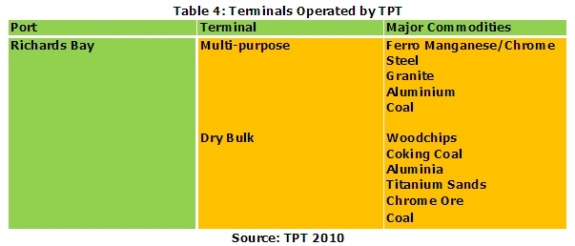
Table 4: Terminals operated by TPT
This section deals with two critical components that help assess port strategic fit and positioning, i.e. cargo handled in the past and cargo projected for the future. This is best determined by quantifying port activity the last four years (2006-2009) as well as current activity; i.e. vessel arrivals (type of vessels and volumes contained); cargo volumes moving across the quays; commodities handled and also which commodities have consistently performed best.
In terms of vessel arrivals, these tend to range from bulk (dry bulk, break-bulk); tankers (liquid bulk); container vessels (reefer; cellular, etc.)
For cargo handled and trend analysis, historic cargo volumes will be presented. Various breakdowns will be used to indicate which cargoes and commodities have contributed greatly to the revenue stream of the port. As ports continually facilitate economic development for the country and region through international trade, it is important to perform cargo demand forecasts to determine infrastructure capacity requirements.
Vessel Arrivals
Cargo Trends in the Port (2006-2009)
Cargo types in the port are generally consolidated and categorized into the following main groups:
- Break Bulk
- Dry Bulk
- Liquid Bulk
- Containers
Forecast Methodology
The basic premise for forecast figures reflect an aggregated growth trend adjusted to fit economic circumstances which accommodate externalities to port planning and development; i.e. Forecast figures vary from low to high as likely growths per cargo category fluctuate; therefore it is imperative that reviews of methodology and other external factors are conducted annually to test feasibility and timing for spatial plan development and infrastructure provision. High-level factors considered per cargo type are presented below:
Break Bulk
- Aluminum Ingots
- Ferro Chrome
- Granite
- Pig Iron
- Steel
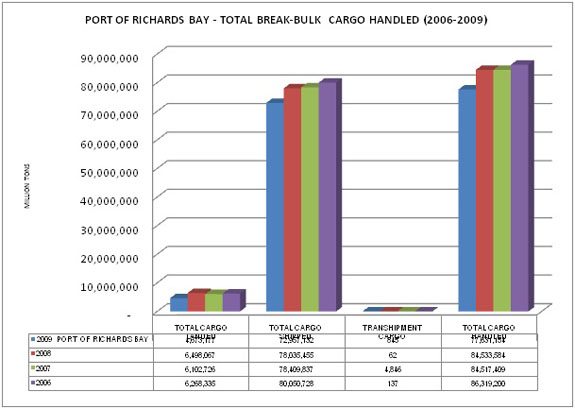
Port of Richards Bay Total Break Bulk CARGO HANDLED (2006-2009)
Dry Bulk
International TrendFleets of dry bulk carriers increased by 4.2%. Further, in terms of the freight market, seaborne shipments of bulk vessels (iron ore and coal) increased by 7.6% producing a better relationship between supply and demand ratio which translates to higher rates for both time and trip charters.
Dominant Commodities
- Coal
- Alumina
- Coking Coal
- Chrome
- Sulphur
- Liquid Bulk
International Trend
UNCTAD reported that average growth volume of seaborne crude oil trade increased by 4.2% and higher around 2007-09High percentages of the tanker trade were in crude oil, with the remainder as petroleum products.
Dominant Commodities
- Bulk Liquids
- Phosphoric Acid
- Fuel Oil
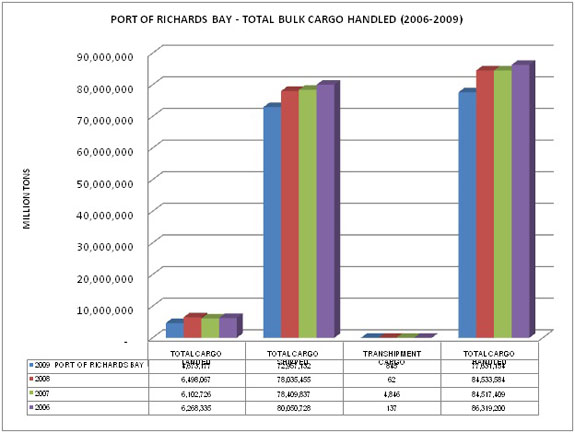
PORT OF RICHARDS BAY - TOTAL BULK CARGO HANDLED (2006-2009)
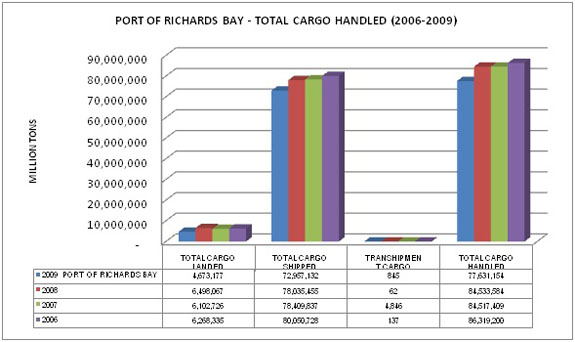
Total Cargo Handled Overall
Containers
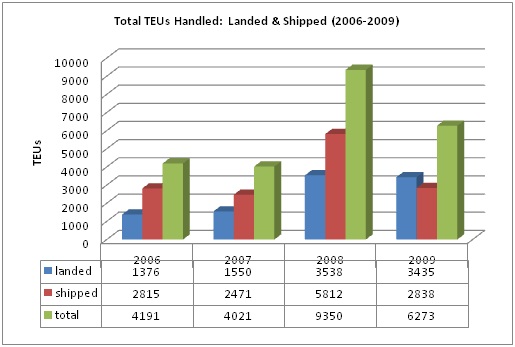
Total TEUs Handled: Landed & Shipped (2006-2009)
The top performing commodities in the Port of Richards Bay (exports 2007) are listed below:
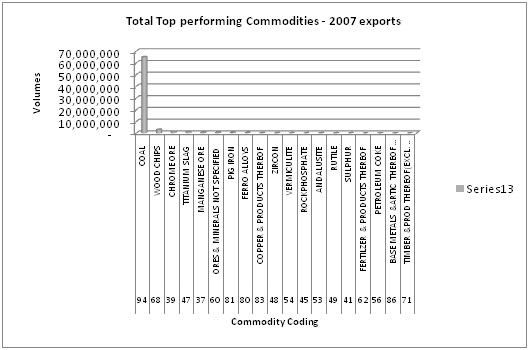
Total Top performing Commodities - 2007 exports
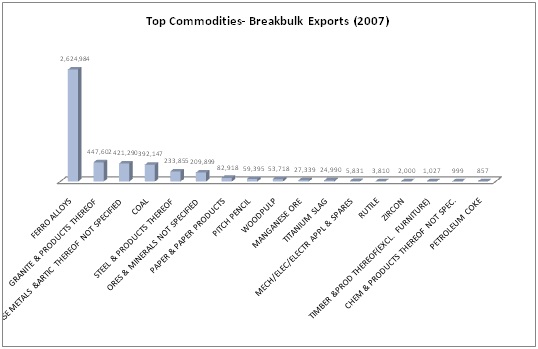
Top Commodities- Breakbulk Exports (2007)
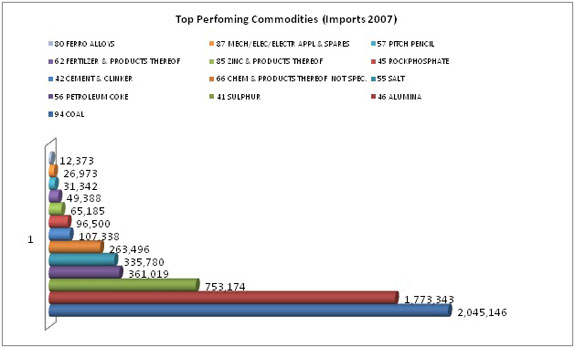
Top Perfoming Commodities (Imports 2007)
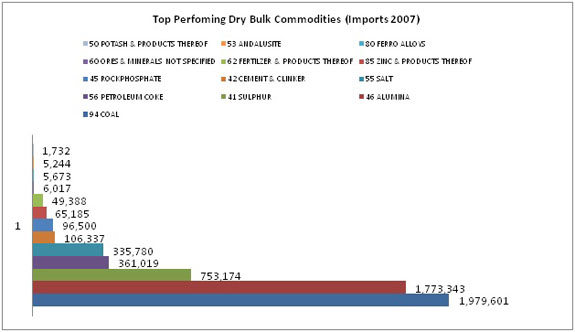
Top Perfoming Dry Bulk Commodities (Imports 2007)
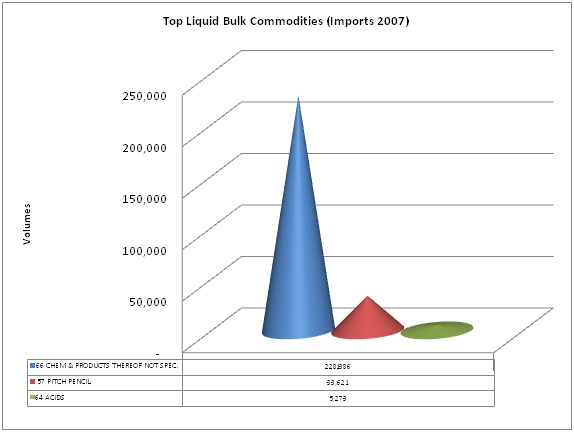
Top Liquid Bulk Commodities (Imports 2007)
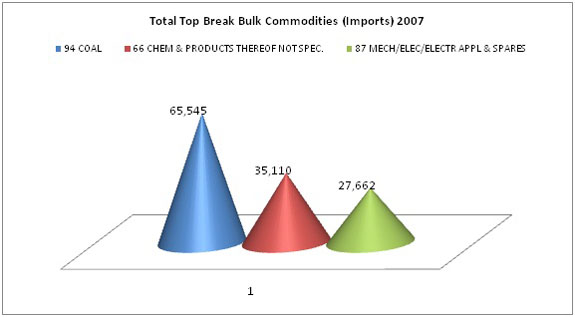
Total Top Break Bulk Commodities (Imports) 2007
Port Demand Framework and Assumptions
Due to supply and demand principles empty containers and trains forecasting is not prudent. The basic principles applied for planning purposes are as follows:
- Capacity Calculation = port transshipment + import + export + empties
- Automotive forecast is conducted in tons. Conversion to units is as follows:
-
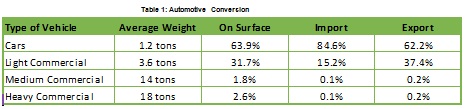
- Corrective measures have been applied to forecasting measures done in 2007/08. Growth has been affected by the world recession, thus infrastructure in most instances has been developed too ahead of demand. A moderate and balanced approach to mitigate against (low and high) growths has been to merge the short term fluctuation in the growth of the economy with the long term 30 year forecast.
- Of importance to note is the unique “grouping” of cargoes used in South Africa vs. those in Europe. Instead of a 62 commodity system, SA utilises a 92 commodity system. This is best observed in projected bulks (break, dry and liquid). To achieve better “comparability” total volumes per cargo are proportionally distributed across the port system. In the following graphs there is SA Ports imports (based on 62 commodity system) vs. NPA SA imports “adjusted” according to NPA type split.
IMPORTS: SA Ports
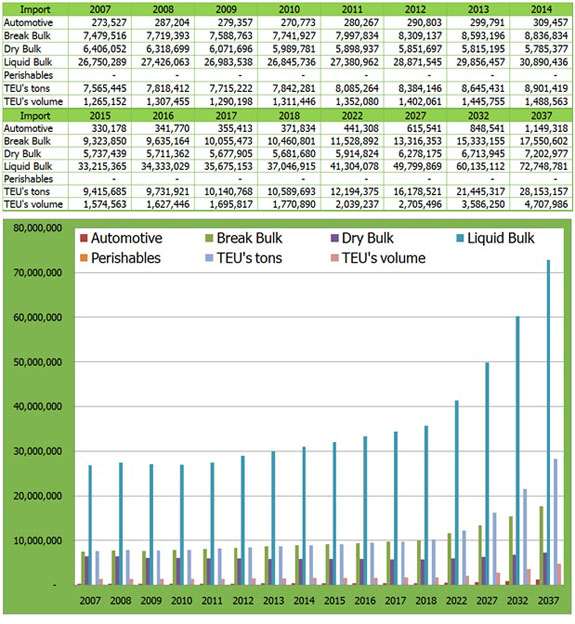
Figure 2: Import for all SA Ports 2007 - 2037
IMPORTS : Adjusted to NPA SA Ports

Figure 3: Import for all SA Ports 2007-2037 (adjusted to NPA type split)
OBSERVATIONS: More deviations exist between break-bulk compared to dry bulk and liquid bulk on the NPA system, while dry bulk is higher. The totals for import and export per Port are comparable. Only the split of the three package type is significantly different. (Source: NIP �" Transnet Group Projects �" 2010)
EXPORTS: SA Ports
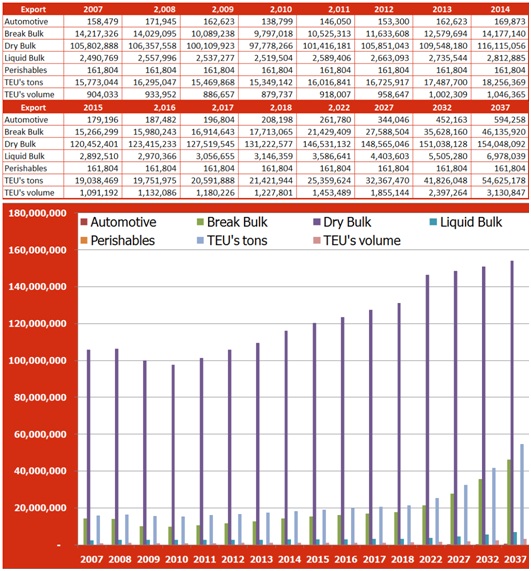
Figure 4: Export for all SA Ports 2007-2037
OBSERVATIONS: Dry bulk cargoes projected growth and movement is dependent on Transnet Freight rail expansion program, i.e. coal and iron ore, etc. and will be capped at tons that can met by TFR. It’s important to note that these volumes are dependent on international markets and price.
EXPORTS: Adjusted to NPA SA Ports
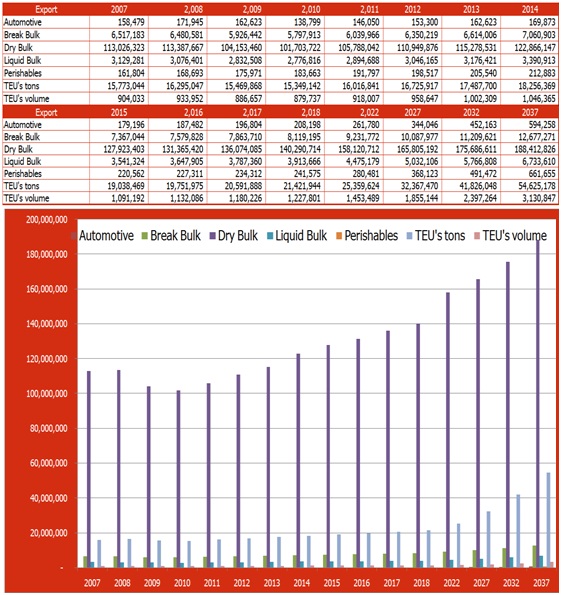
Figure 5: Export for all SA Ports 2007-2037 (adjusted to NPA type split)
OBSERVATIONS: Within the “bulk” split, break bulk is less by 33,458,649 tons compared to SA ports while dry bulk is higher by 34,364,734 tons in NPA adjusted projections.
Port Forecasts per package type adjusted to NPA type split
Port forecasting of imports results from a proportional adjustment to NPA’s grouping of commodities. The applied formula to adjust the tonnages is: Type of Bulk NPA / Total Bulk NPA * Total Bulk US = Type Bulk US; and applies to all three package type. The output is a redistribution of the Total Bulk of Stellenbosch proportional to the three package types of NPA.
Three areas not redistributed are: Automotive, TEU’s and Perishables. These already form the NPA commodity grouping.Containers
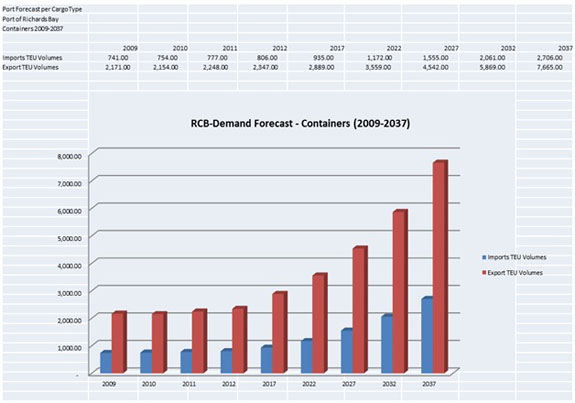
Figure 6: TEU in Volumes per port
Automotive
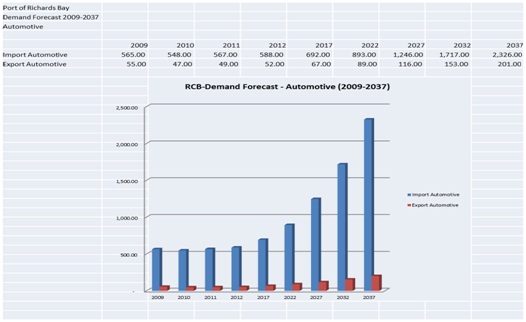
Figure 7: Automotive in tonnage per port
Break Bulk
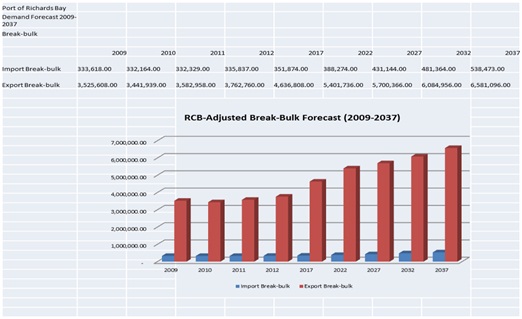
Figure 8: Break Bulk in tonnage per port
Dry Bulk
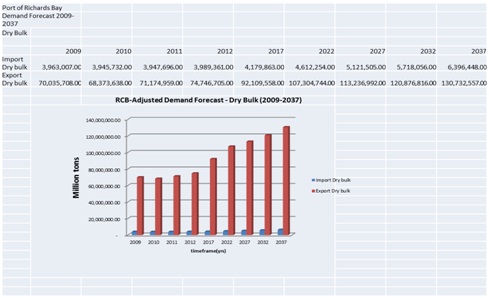
Figure 9: Dry Bulk in tonnage per port
Liquid Bulk
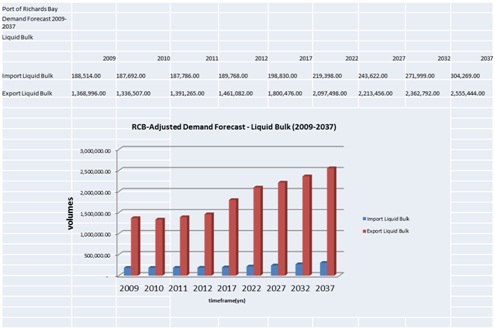
Figure 10: Liquid Bulk in tonnage per port
Perishables
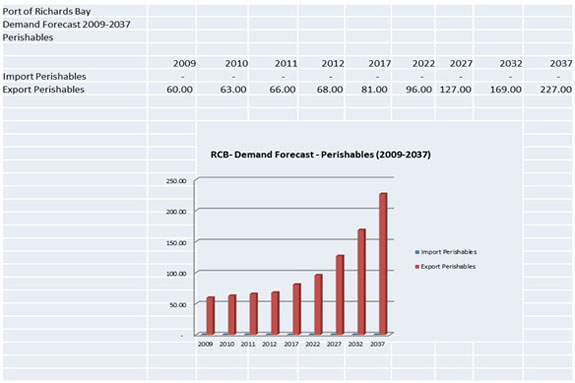
Figure 11: Perishables in tonnage per port
The port of Richards Bay plays an important role within the regeneration and competitiveness of the national and regional economy especially in terms of moving high volumes of bulk cargo. In this regard, the Port Authority has a mandate to ensure that infrastructure is developed ahead of demand with critical performance measures for greater productivity and producing a consistent rate of return. This is best demonstrated by the continued assessment of planned projects such as: Ship repair facility, additional bulk liquid handling berth and break-bulk & dry bulk berths, upgrading roads and rail services and in the longer term a container handling facility at an existing berth.
What can be observed at the port is that operational challenges and market forces play a determinant factor to the port’s ability to meet targets set by either the broader “Transnet” machinery and/or stakeholders such as cargo owners. Secondly, international markets dictate supply and demand of some key goods moving through the port; i.e. China’s growth and development has produced a higher demand for raw mineral such as manganese, coal, etc. However, due to the deterioration of the road between Mpumalanga (R33) and the Port of Richards Bay, the port has lost cargo to the port of Maputo. This also impacts the port in terms of rail efficiencies as seen by cargo owners in the Mpumalanga region. Increased volumes of manganese, coal and fruit is being redirected to either Maputo or Cape Town (fruit). Cargo owners see road haulage a surer bet in terms of creating bigger margins in productivity and retaining their global market share.
In conclusion the port is strategically located in proximity to the Maputo Corridor and Port of Maputo, making its continued attraction of cargo a challenge. This can be a good situation to be in as a port as it will force the various arms of Transnet to have a cohesive infrastructural program and approach to service and customer delivery. The Port serves as an “end” in the logistics chain. Without functioning, efficient and “predictable” service to all customers, the productivity and market share of the port will be negatively impacted. Sometimes making a profit within the national mandate of “lowering the cost of doing business” and promoting access and efficiencies in the supply chain (inbound and outbound rail in particular); the opposing demands will render Transnet ineffective in providing relevant infrastructure to meet national social and economic development requirements. One hopes that success PPP operational agreements extending to rail operations will help to alleviate capital, operational and human cost demands currently being felt by Transnet.
Copyright © 2010 Mpumalanga Province Freight Transport Data Bank [ - ]
All rights reserved.
This website conforms to W3C Standard [ - ]