Mpumalanga Province Freight Data Bank
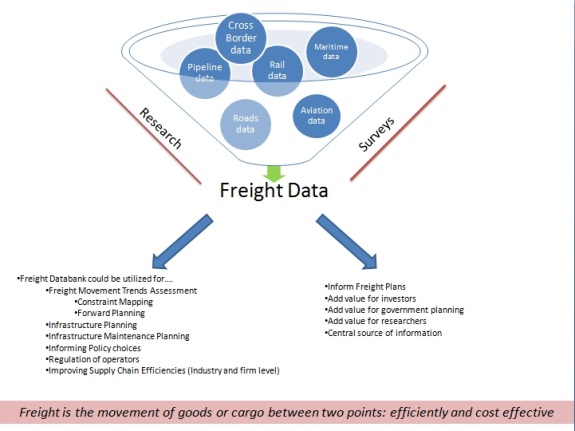
This Data Bank provides one with information about authorities within the province, industries, aviation, maritime, cross border, rail and roads sectors in the province. The statistics will provide you with detailed information about the movements of freight in the province while the maps will provide a more graphical view. The image below depicts the process of producing the databank.

Authorities
The Overload Control Strategy sufficiently identifies the issue of overloading within the province, it further states that traditional approaches to overload control has not been successful and that these approaches will continue to be insufficient." [ Read More ]

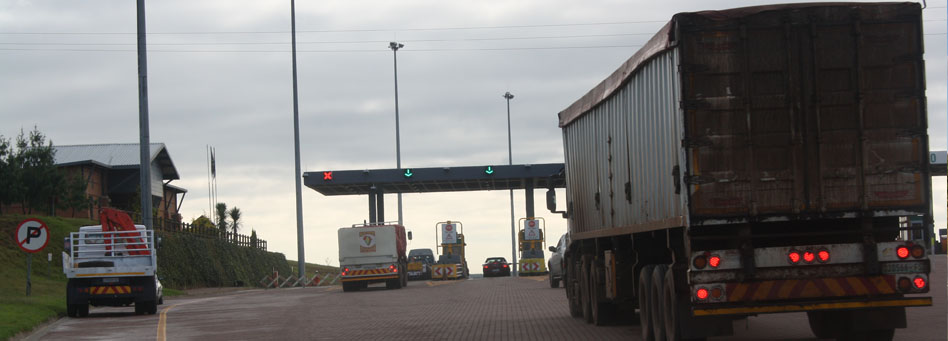
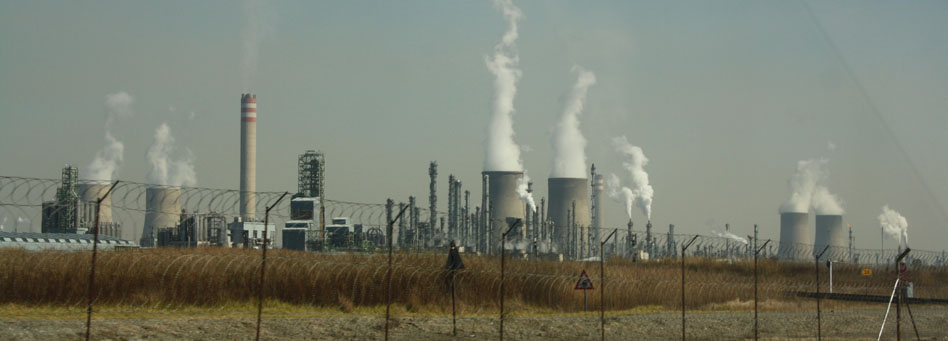
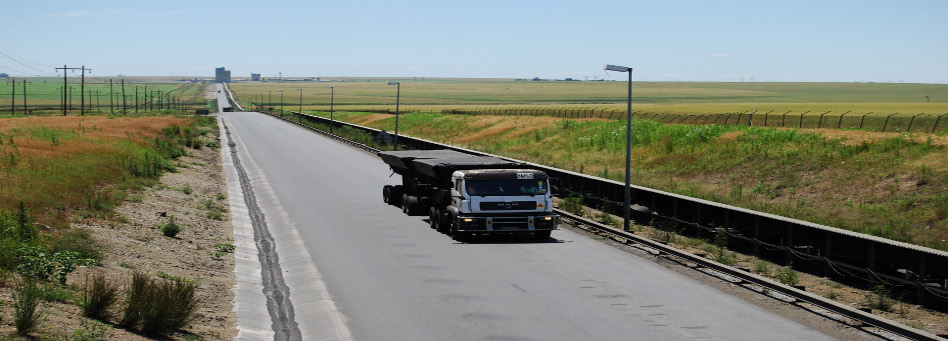
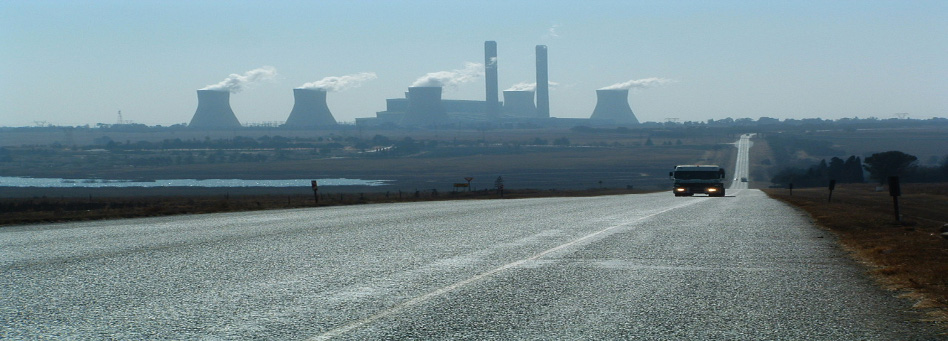
Roads
Currently, road transport is the most used mode of transport in Mpumalanga. This is in line with the country's trend. According to the State of Logistics Survey for South Africa, 2008, road freight constitutes 87% of all freight movement..." [ Read More ]

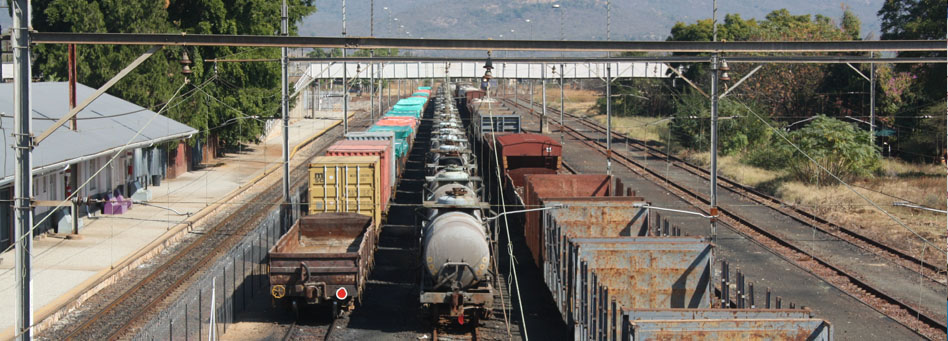
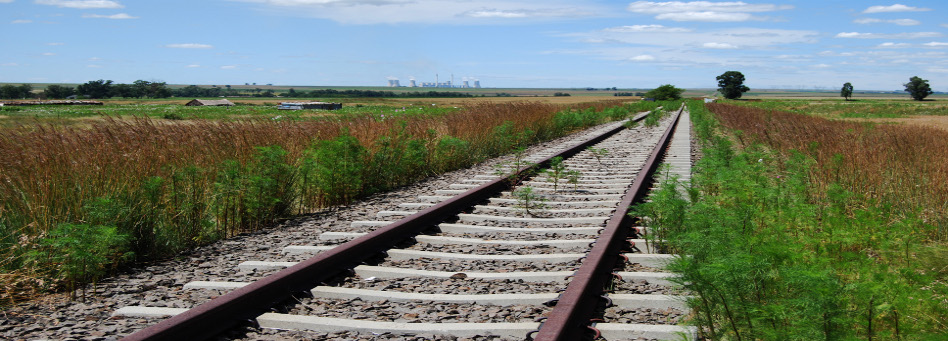
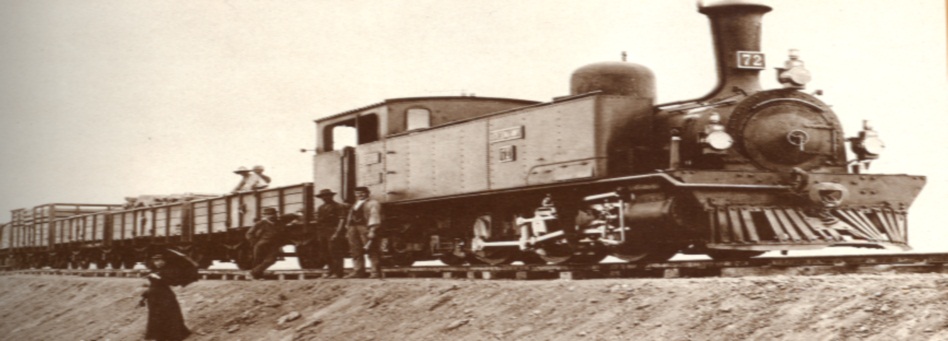
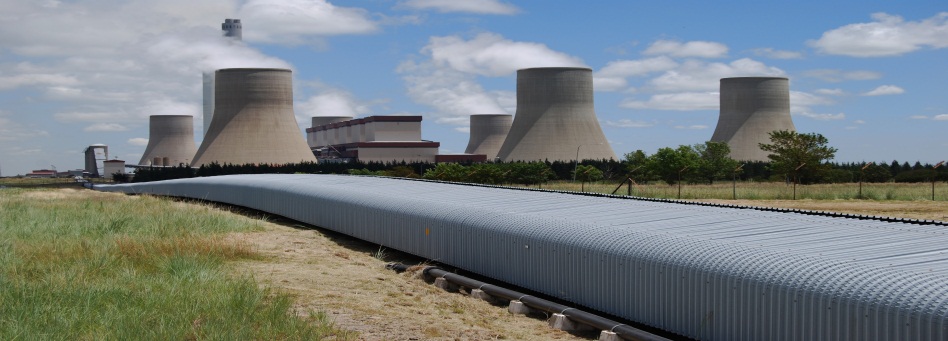
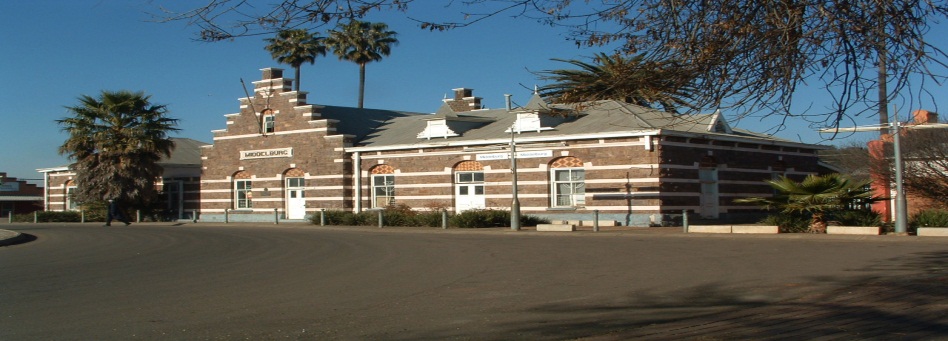
Rail
Transnet Freight Rail's 2 233 route-kilometre system in Mpumalanga is a crucial element of the South African transportation system and is a significant factor in the movement of freight within and through the Province to countrywide domestic destinations..." [ Read More ]

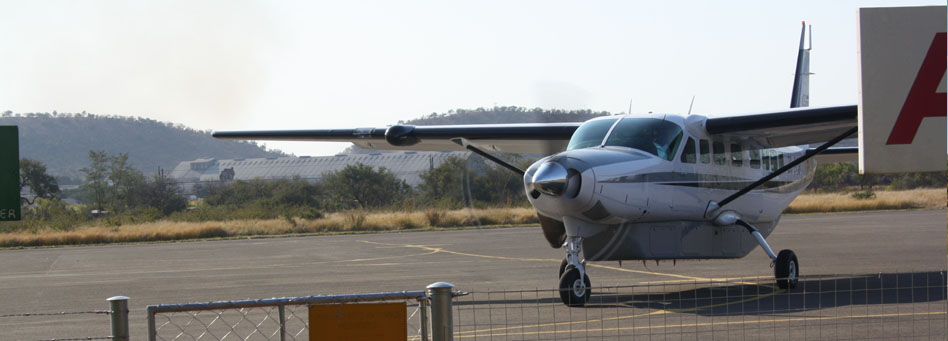
Aviation
Kruger Mpumalanga International Airport is the official port of entry for Mpumalanga Province; it began operations in October of 2002 as a builder operator..." [ Read More ]

Maritime: Durban
The Maritime sector serves as a strategic freight-logistics platform earmarked to facilitate trade (i.e. import and export of goods) of high volume and tonnage cargoes for regional and national economic growth." [ Read More ]
Roads
From the data observations, there has been an increase in traffic volumes of about 30%. In particular, the N4, N2, R570 (Jeppes Reef - Malelana), and R571 (Komatipoort - Mananga), have seen a significant increase in traffic volumes. Whilst the is an overall increase, some routes have seen a drastic decline in the traffic volumes. These include N11 (Volksrust - Ermelo), R36 (Carolina - Watervalboven), and N17 (Lochiel - Oshoek)
It should be noted, however, that there can be a lot of factors that can be attributed to the variances. These include the different periods in which the surveys were conducted. In 2010, the surveys were conducted during the months of April and May, whilst in 2006, the surveys were conducted during the months of September and October 2010.

Roads Freight Comparison
Roads Freight Comparison
Rail
It is difficult to be certain of stated traffic fugues because of different Spoornet (TFR) sources over the period but it appears that rail traffic into, from, within and transiting Mpumalanga has increased substantially during the review period.
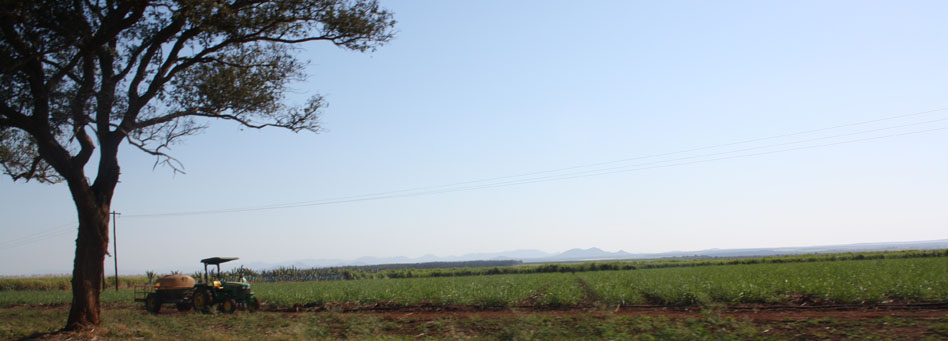
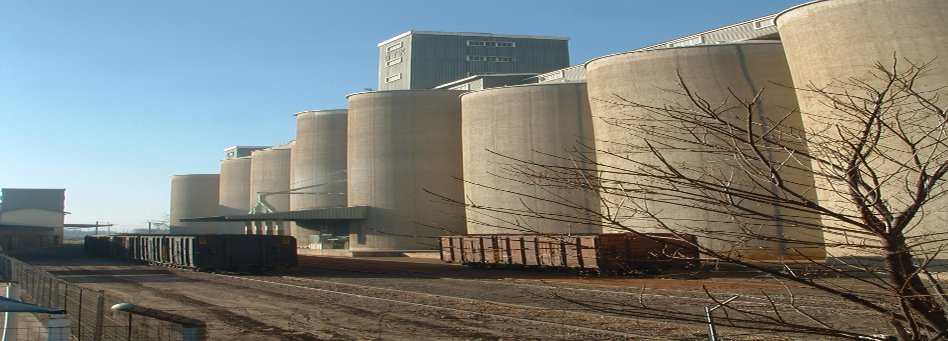
Traffic volumes and transport routes utilised vary from year to year for both road and rail, depending on short and long-term demand in the domestic and international market. Coal traffic to power stations is fairly constant but exports of various minerals varies with international demand. Agricultural traffic is dependent on weather conditions and crop harvests. In one year maize may be exported, while the following year it will be imported. This places demands on the transport system in order to have capacity for traffic in good years, while at other times there may be a significant surplus capacity.
In the case of traffic transiting Mpumalanga, export chrome traffic generated in the North West Province and routed through Mpumalanga to Richards Bay grew from about 434 000 tons in 2003-4 to 746 135 tons in 2007-08. Ferrochrome traffic from the North West dropped from over 811 000 tons to 556 985 tons, while Granite traffic from the North West dropped from 324 568 tons to 240 122 tons during the present review period. This was not necessarily due to an increased road share in the market but to international demands, etc.
On the other hand, TFR improved their services on coal delivery to the Majuba Power Station at Palmford (near Volksrust), and the volume grew from about 3.4 million tons in 2003-04 to over 7.3 million tons in 2007-08. However, over 10 million tons was still on road and it is for this reason that ESKOM are planning to construct a high capacity heavy-haul line from near Ermelo to the power station. Unfortunately, export coal traffic on the Richards Bay route fell from over 70 million tons to just 61 million in the present review period, due mainly to TFR capacity constraints. In comparison, Rock Phosphate traffic from Phalaborwa increased from 1.7 million to nearly 1.9 million because of improved over-the-road performance and Magnetite traffic increased from just 112 000 tons to over 1.9-m tons.

Rail Freight Comparison
Rail Freight Comparison
Ports
» Port Maputo
Distinct growth in containers (imports/exports) and chrome & alloys (exports) from 572 in 2005 to 960 in 2009 and 403 to 738 respectively. Categories such as steel scrap, steel products, citrus and liquid bulks fluctuate as these are strictly market driven. Dry bulks and "other bulk cargo" seem to be stable around low 300 to high 600. Auto handling only started after 2007 and has shown a positive trend. Bulk liquids have grown since the previous study when (0) was recorded and were at 60,000 tons (2009).

Port Maputo 2001-2009
Port Maputo 2001-2009
» Port of Durban

Port of Durban: Containers Comparison
Port of Durban: Containers Comparison

Port of Durban: Bulk Cargo Comparison
Port of Durban: Bulk Cargo Comparison

Port of Durban: Break Bulk Cargo Comparison
Port of Durban: Break Bulk Cargo Comparison
- Containers
There has been a significant positive growth from 1,690,885 TEUs in 2004/2005 to a high of 2,560,366 TEUs in 2008/2009 indicating a growth percentage of 34%. Trans-shipments for imports increased from 166,255 in 2004/2005 to 307,343 TEUs in 2008/2009. For exports (transshipments) the figures are almost similar at 166,205 in 2004/2005 and at 310,135 in 2008/2009.
The differential between export and import is relatively narrow at 49,206 in favour for exports. In terms of growing the economy and being a strong and competitive partner in global trade, South Africa has a long way to go as a healthier ratio should reflect exports well exceeding imports.
- Bulk Cargo
Trans-shipment activity has fluctuated from 131,681 in 2004/2005 to a high of 198,803 the following year, then a sharp decline to 81,895 in 2008/2009.
Imported (landed) bulk has remained relatively stable from 25,470,321 tons in 2004 to a high of 28,675,022 in 2007/2008 and a slight decline in 2008/2009 of 27,068,586 tons. Exported (shipped) bulk was at its highest in 2004/2005 at 8,061,298 tons but reached its lowest in 2007/2008 at 6,370,479 tons. Since then it has been rallying to 7,055,419 tons in 2008/2009, but still relatively lower than 2004/2005 figures.
- Break Bulk
Imported (landed) in 2004/2005 was recorded at 2,761,447 tons and reached a high of 4,355,419 tons in 2006/2007; since then there has been a decline recording figures close to 2004/2005 at 2,690,057.
Exported (shipped) break-bulk has remained relative stable between 3,440,396 in 2004/2005 with highest figures in 2005/2006 of 3,854,637 and has declined to 3,033,254 in 2008/2009. Overall comparison is that 2004/2005 recorded a healthy figure of 6,405, 111 which led to a slight increase in 2006/2007 at 7,692,855, but has since declined recording the lowest levels at 5,912,756 in 2008/2009.
» Port of Richard's Bay

Port of Richard's Bay: Containter Comparison
Port of Richard's Bay: Containter Comparison

Port of Richard's Bay: Bulk Cargo Comparison
Port of Richard's Bay: Bulk Cargo Comparison

Port of Richard's Bay: Break Bulk Comparison
Port of Richard's Bay: Break Bulk Comparison
- Containers
There has been a slight growth in TEUs handled from 5,542 TEUs in 2004/2005 to 8,323 TEUs in 2008/2009 indicating a growth percentage of approximately 30%.
Trans-shipments for imports were non-existent (0) between 2004/2005 until a recorded 27 TEUs in 2008/2009. For exports (transshipments) the figures slightly better, but still relatively low in terms of container handling in the port starting from zero (0) in 2004/2005 to 105 in 2008/2009. The differential between export and import is relatively narrow at 938 TEUs in favour for exports (imports in 2004/2005 at 1,324 and increased to 3,167 in 2008/2009 and exports at 4,218 in 2004/2005 and increased to 5,156 TEUs in 2008/2009).
- Bulk Cargo
No trans-shipment has been recorded for the study periods.
However, of importance is that "Deep-Sea" cargo movement is predominant between imports and exports. Relatively high figures have been observed in exports overall with 2004 having the highest at 74,660,810 tons and 2008/2009 reflecting 72,633,486 indictang a decrease of 3%. Imports are lower starting at 5,506,774 tons in 2004/2005 but have slightly increased to 6,076,102 tons in 2008/2009.
Overall bulk handling has fluctuated from 80,167,584 tons in 2004/2005 reaching highest figures the following year at 84,875,553 but has shown a negative trend recording 78,709,588 tons in 2008/2009.
- Break Bulk
Similarly, "Deep-sea" cargo movement predominates (imports and exports) with highest for imports at 289,676 tons in 2004/2005 and has decreased since 135,690 in 2008/2009.
Exported (shipped) break-bulk in 2004/2005 recorded at 4,497,213 tons in 2004 but has had a slight decline between the study period to 3,776,379 tons in 2008/2009. Despite the decline export figures are much higher than imports.
Aviation

Aviation Average Freight Comparison
Aviation Average Freight Comparison
Comparison was done between key elements of the study. Most of the statistical elements under consideration display good comparison with an upward trend on the new data. Air freight data between the old and the new freight databanks differ significantly which is a point of concern. The source of the deviation seems to be a typing error, instead of 7500kg per month which will compare well with current data; they possibly typed 7500kg per day mistakenly.
information sources
- Mpumalanga Provincial Government
- Gert Sibande District Municipality
- Nkangala District Municipality
- Ehlanzeni District Municipality
- Other Sources
- Stats SA
- Demarcation Board
- SALGA (South African Local Government Association)
- DLGH (Department Of Local Government And Housing)
- ATNS
- Airlink
- Port Maputo
- SAFIRI
- TracN4 / SANRAL
- Transnet
- MEGA
- Air Freight Association
- MCLI
- Global Insight
Copyright © 2010 Mpumalanga Province Freight Transport Data Bank [ - ]
All rights reserved.
This website conforms to W3C Standard [ - ]