The status of the Port of Durban is as a core container port and secondly its position within the general bulk cargo - export flow corridor between Gauteng and Durban. This ensures its priority status in terms of the Moving South Africa strategic action plan and a major port for container and auto handling.
To this end, the ports development program continues to be on infrastructure investment to improve its efficiencies for both containers, auto and break bulk. Similarly, investment strategies ( increased container and auto terminal) aimed at trade flows have been required in order to make the Port attractive to shippers whilst also providing supporting infrastructure (rail and road) to improve the overall logistics network.
Transport costs to the hinterland and government policies with respect to supporting economic growth have resulted in substantial adjustments in the structure and organisation of land and sea transport. Hence rail and road transport infrastructure and services form a critical assessment package in maintaining the ports premier status and dominance on the African Continent.
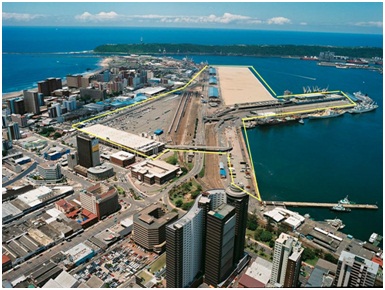
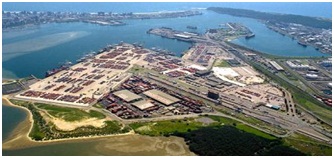
Map1: Aerial View of the Port of Durban - Source TNPA 2010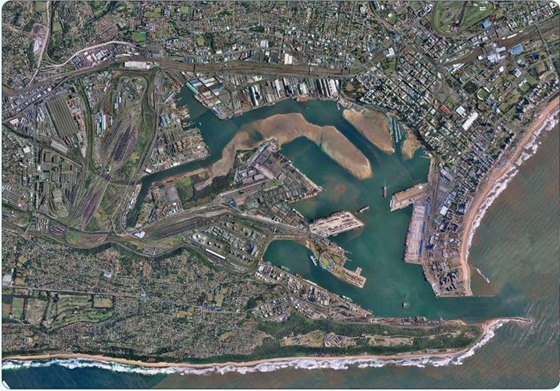
It is evident that the Port of Durban (PoD) plays a critical role in the economy of the country. Given the known spatial capacity constraints of the port and the capital amount recently spent, and the potential changes to regional and national cargo movements, it is imperative that operational efficiencies and sustainable land use management principles are promoted for effective functioning of the port as a logistic platform.
The significance of the Port of Durban to the country's economy results from the reality that two-thirds of the country's annual trade moves through the port. As a vehicle for facilitating economic growth, the port encourages competitiveness for local and regional industries by providing economies of scale. Even with the Port of Ngqura( primary focus is transhipment), PoD remains the premier choice for container ships along the east coast of southern Africa. In short, the port continues its strategic position as a terminal port in its own right able to accommodate all vessels and wherever possible encourage trans-shipments.

Located in KwaZulu Natal Province (KZN) on the eastern coast at Lat:29 52S Long:3102E, the port is South Africa's premier port in container and general cargo handling with 57 berths, 6 repair berths and 302 km of rail track. The port handles a wide variety of commodities with the highest number of containers in sub-Saharan Africa. A broad range of shipping and maritime industry services and facilities are found within the ports boundaries which encompass a land mass of 1,854 hectares, water surface area of 892 hectares at high tide and 679 hectares at low tide.
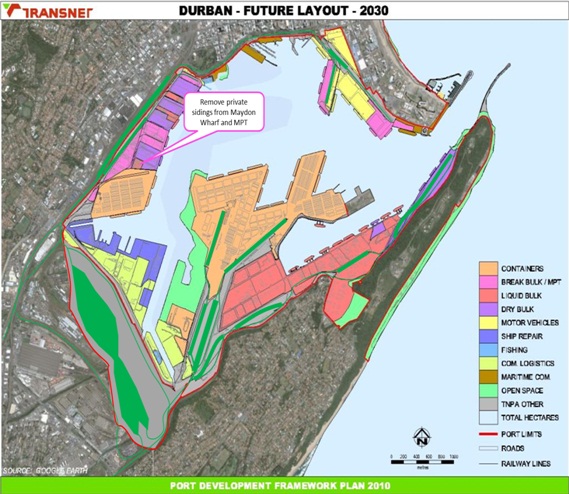
The ports shoreline is approximately 21 km. With the new widened (225 meters) and deepened entrance channel (-19 meters at approach, -18 meters at entrance and -16 meters at inner port channels and basins); the port can handle container vessels with capacity of up to 9,200 TEUs . It is clear that port capacity to meet future growth is catered for in its future development plans. (see Map 3a: Port Future Layout 2030).
Map 3a: Port Future Layout 2030 - Source TCP 2010
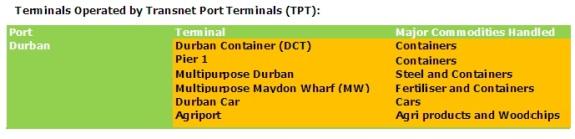
Transnet Port Terminals (TPT) a subsidiary of Transnet; is the largest terminal operator while there are privately operated terminals. The main terminals are the Durban Container Terminal (DCT), Pier 1 and Pier 2, T jetty passenger terminal, Durban Export Terminal for fresh produce, Durban Car Terminal, Maydon Wharf (including sugar and forest products terminals), and Island View Storage for liquid bulk.
As previously mentioned, major developments at the port have increased its ability to handle larger cargo volumes. The most recent expansion has been the construction of berths D to G at the City Terminal and the PoDD 2005 which aimed at developing infrastructural upgrades with objectives to:
- Provide additional container handling capacity for future demand
- Consolidate general cargo handling facilities and align operations for better efficiencies and functionality
The programme primarily contained (Durban Container Terminal):
- Capacity provision via additional equipment (3 quay-side cranes and 20 straddle carriers);
- Equipment replacement program and infrastructure improvements. This has increased capacity from 1.3 million TEUs to 1.6 million TEUs per annum with additional capacity of 325,000 TEUs per annum being sourced through Pier 1 conversion

Port Berth Layout Source TNPA 2009
Documenting the transportation network (support infrastructure such as road, rail, pipelines, etc.) forms the functioning elements of the port. External and internal roads and rail system allow for landside and hinterland cargo movement. This section provides the current status of the transportation system.
In addition, waterside infrastructure inclusive of terminals, quays, berths, equipment form another critical element for effective functioning of a port. These are all presented in this section with respective profiles.
Road Network
The external street network servicing the port contains a mix of port and public traffic; namely:
- Edwin Swales Drive Major 6-lane dual carriageway arterial; access for Pier 1, Pier 2 and Island View traffic.
- Old South Coast Road Major 4-lane single carriageway arterial, mainly serving Pier 1, 2, Maydon Wharf and Island View traffic.
- Victoria Embankment Major 6-lane dual carriageway CBD collector distributor, serving the Point Precinct, to the east and Maydon Wharf to the south.
- Point Road - Shepstone Road one-way pair Major 8-lane one-way pair CBD collector distributor, serving the Point Precinct.
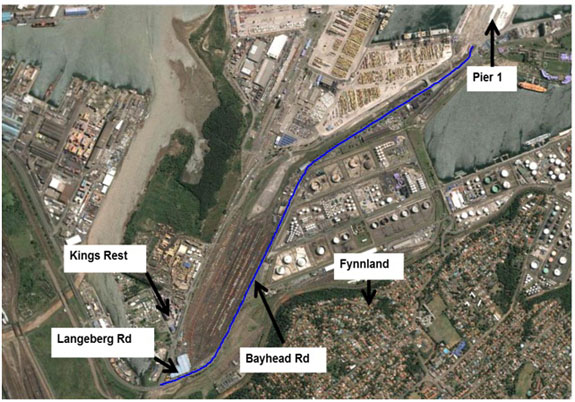
- Bayhead Road Major 6-lane dual carriageway collector distributor serving Pier 1, Pier 2 and Island View traffic, Bayhead and Fynnland.
With some exceptions, these roads all suffer from congestion during peak periods due in part to their close proximity to and locations within the Durban CBD. In response to the crushing congestion, Khangela Bridge (a joint venture between Transnet and the Municipality) was finalised in 2009.
Map 2: Port of Durban Current layout and Zoning Scheme - Source: TCP- 2010
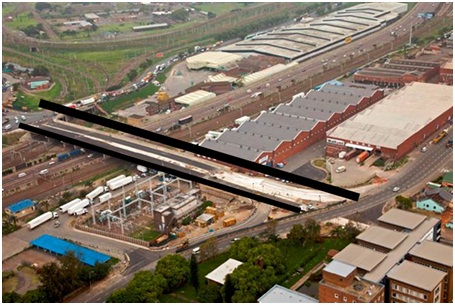
Diagram 4: Traffic Movement System as influenced by Road Proposals TNPA 2010
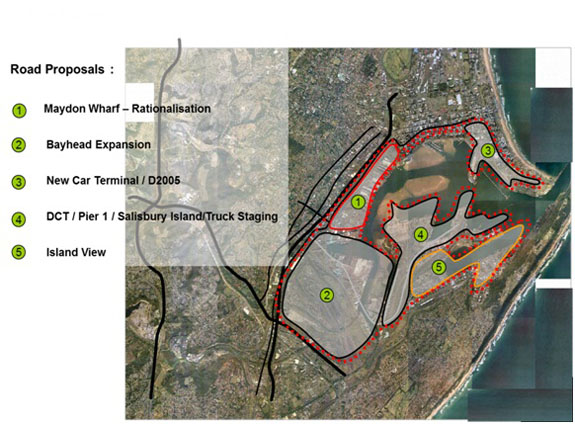
Additional road improvements projects have been proposed in line facilitate proposed medium and longer term port capacity projects such as:
- Maydon Wharf Rationalisation
- New Car Terminal /D 2005
- DCT/Pier 1/Salisbury Island and Truck Staging; and
- Island =View
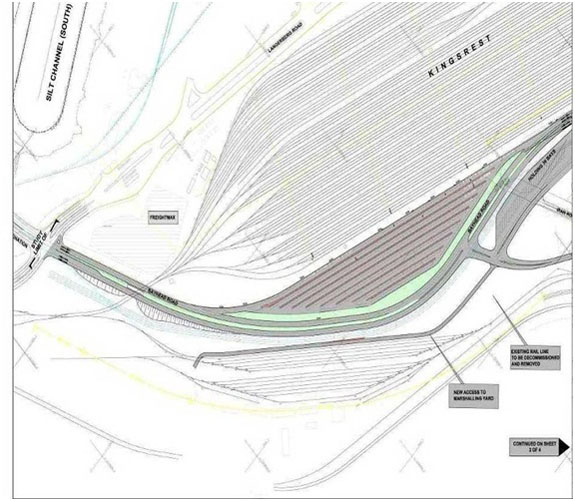
Finally as part of future container capacity, Bayhead expansion is still under feasibility analysis to determine environmental, design and operational parameters. Inclusive to this is having functional inland/surface (road and rail) linkages. Bayhead Road widening and Truck Staging projects form a critical component of the development.
Diagram 5: Bayhead Road Widening - Source TNPA 2010
Rail Network
Transnet Freight Rail is the only rail service provider to the Port of Durban via the Bayhead Marshalling yard, which is supplemented by the Kings Rest Marshalling yard and smaller Maydon Wharf and Point yards. The Bayhead yard is currently underutilised and the Kings Rest yard is the de facto main marshalling yard for Pier 1, 2 and Island View.
This internal network is connected to the main line between Durban and Johannesburg via the central portion of the Umlazi-KwaMashu rail trajectory and to the Richards Bay and Durban line via the northern portion of the Umlazi-KwaMashu trajectory. As there is a continued shift towards road-based transport, challenges to redundant capacity on the rail network are being addressed. The exact amount is difficult to quantify but conservative estimates indicate a spare capacity of between 30% and 50%.
Diagram 6: Truck Staging - Bayhead Road (see rail rationalisation process) - Source TNPA 2010
Waterside Infrastructure
Port Parameters
Port Terminals
The port has 58 berths and 20 terminals. Approximately 45% of South Africa's break-bulk cargo and over 61% of all containers move through the port annually. On average 200,000 containers per month are handled at the ports terminals.
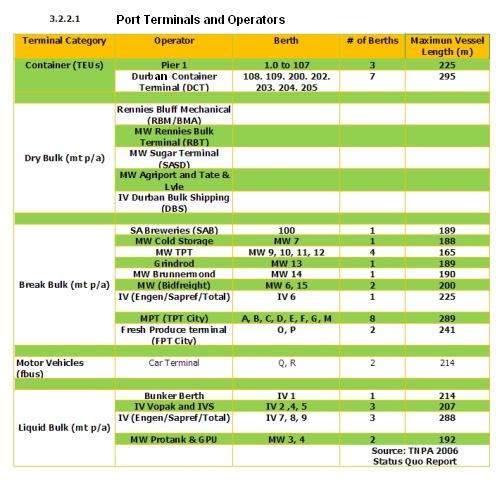
Port Terminals and Operators
Terminals Operated by Transnet Port Terminals (TPT):
POINT T-JETTY TERMINAL
POINT - T -JETTY TERMINAL 1
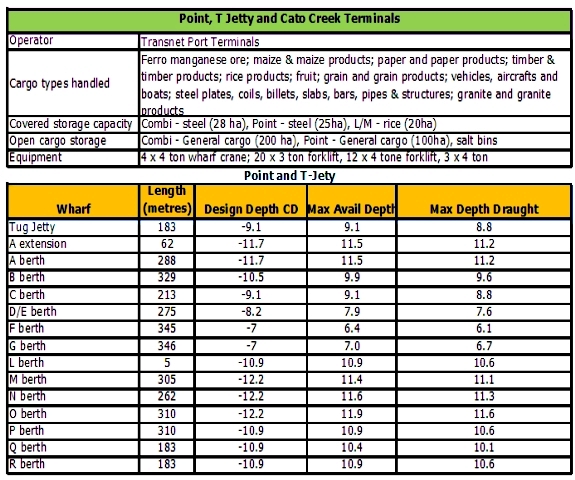 Source TPT 2010
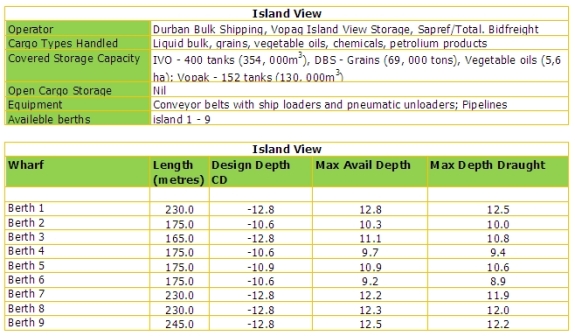
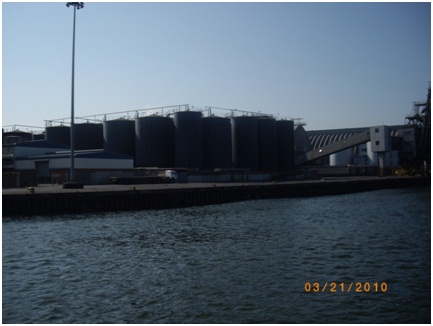
ISLAND VIEW TERMINAL
CONTAINER TERMINALS (DCT, PIER 1 AND 2)
Figure 1: Before Container Terminal Expansion
POINT - T -JETTY TERMINAL 1
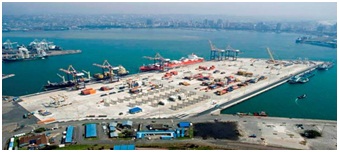
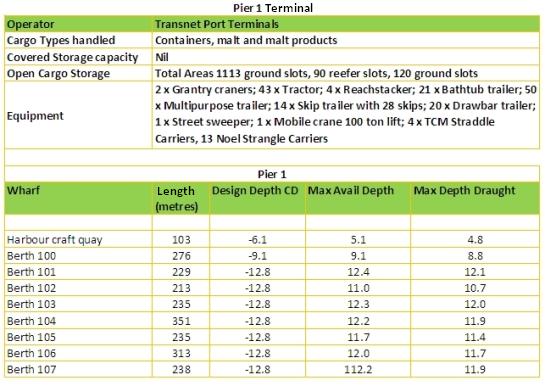
Pier 1 - Terminal
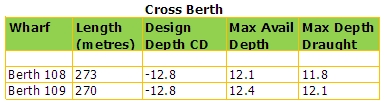
Cross Berth
Pier 2
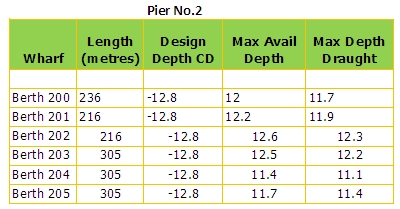
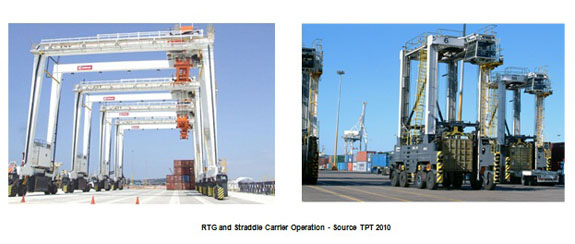
RTG and Straddle Carrier Operation
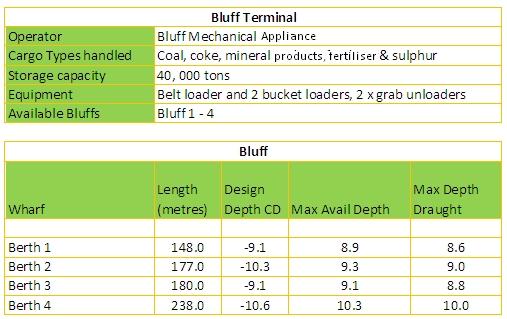
BLUFF TERMINAL

Photos by E.R.L. (Mamsie) Khoapa March 2010
Source: Transnet Capital Projects 2009
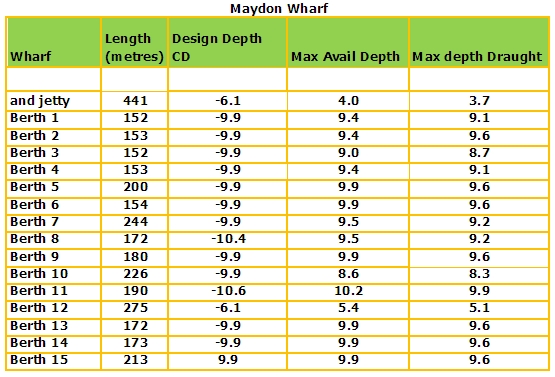
MAYDON WHARF
Photos by E.R.L (Mamsie) Khoapa March 2010
Source : Transnet
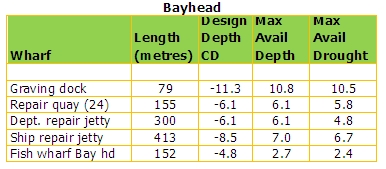
BAYHEAD TERMINAL
BULK HANDLING TERMINALS AND HANDLING RATES
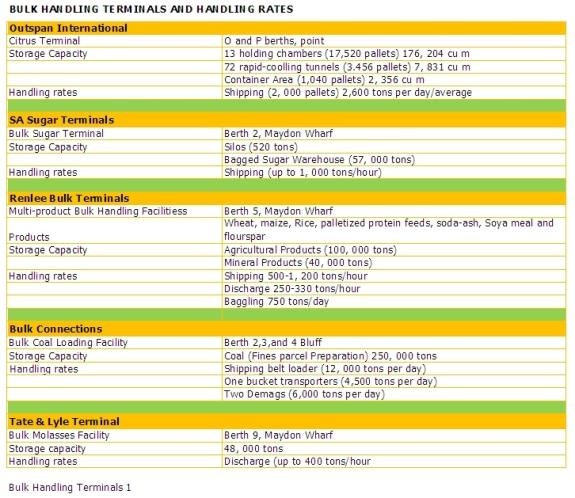
Bulk Handling Terminals 1
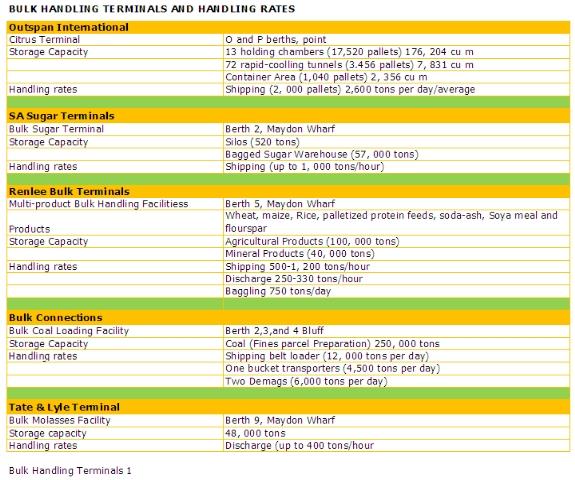
Bulk Handling Terminals 2
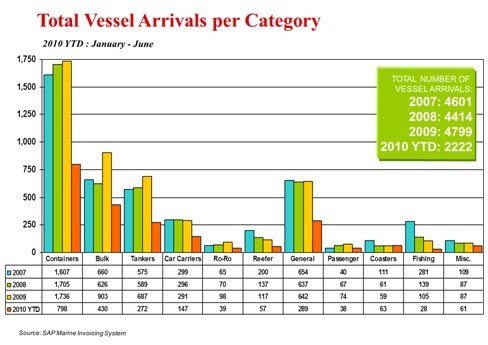
Vessel Arrivals
In terms of containers handled in 2009, over 6 Million TEUs were handled at the Port of Durban. The most distinguishing feature of the port is its level of activity. The port is renowned for being both the sub-continent and the country's busiest port as is evident by the number of containers and general cargo handled each year which approximate 31,4 million tons of cargo worth more than R50 billion each year.
Forty four per cent of South Africa's break-bulk cargo and 61 %of all containerised cargo flows through the Port with an average of 83, 000 containers per month handled at the container terminals. Economic impact of the port can be quantified by the number of employment opportunities which correlated to 6 000 direct employment and approximately 30, 000 people depending upon the port and its associated activities.
Source_ TNPA-Durban 2010
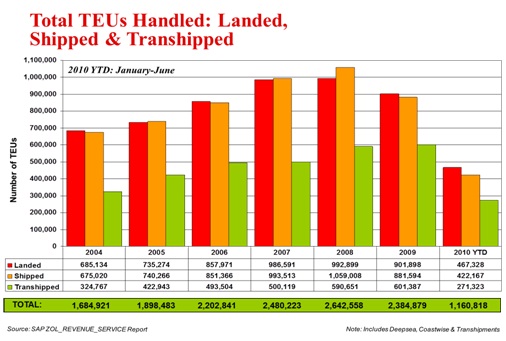
Container Volumes
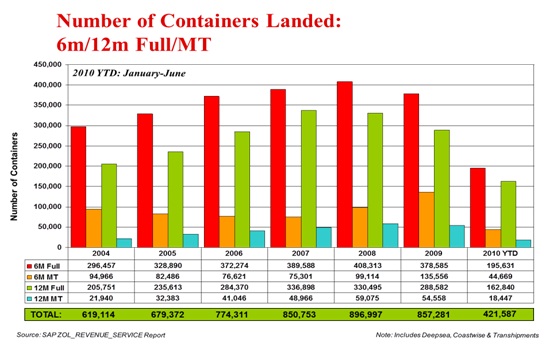
Containers Handled-shipped-landed (6m vs, 12 m)
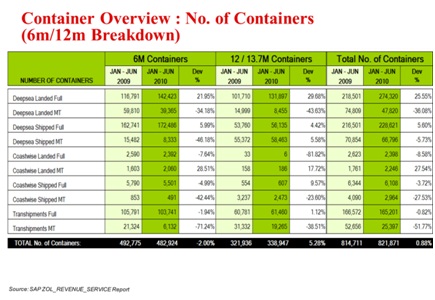
Container Overview Comparative Sizes
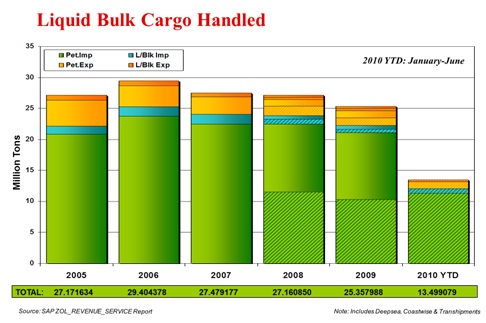
Liquid Bulk Volumes
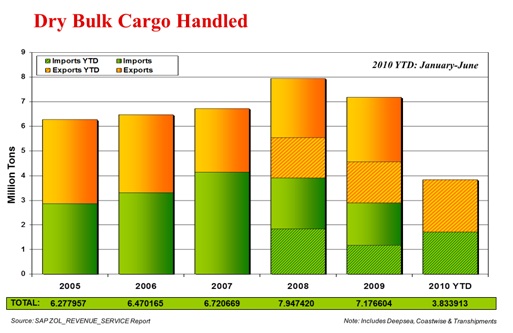
Dry Bulk Volumes
Container Overview Comparative Sizes
Commodity Breakdown
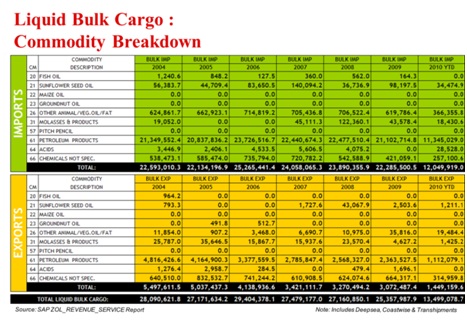
Liquid Bulk: Commodity Breakdown 2004-2010 YTD
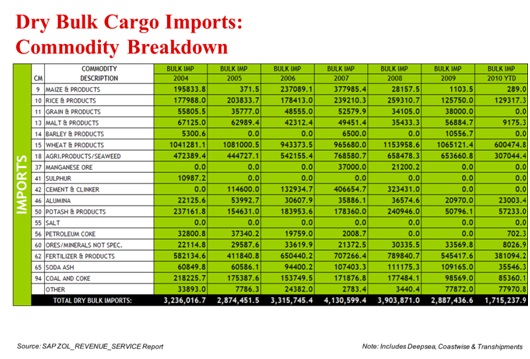
Dry Bulk Commodity Breakdown 2004-2010YTD
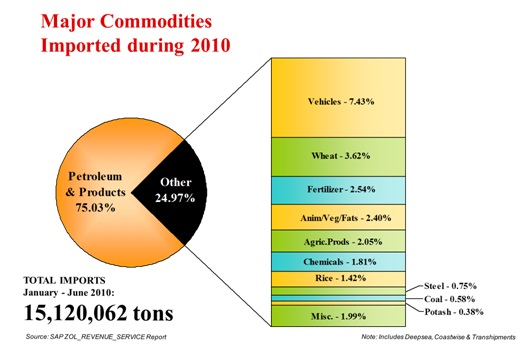
Top Commodities Imported (2010 YTD)
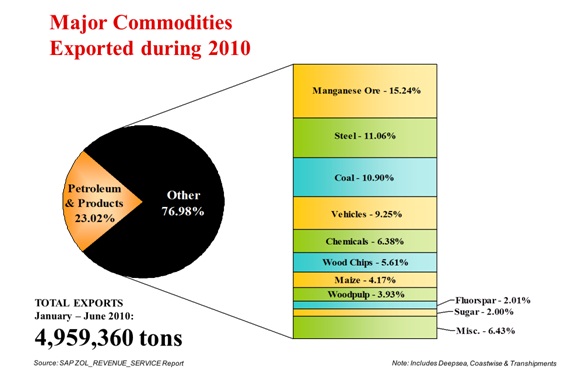
Top Commodities Exported (2010 YTD)
Port Demand Framework and Assumptions
Due to supply and demand principles, empty containers and trains forecasting is not prudent. The basic principles applied for planning purposes are as follows:
Top Commodities Imported (2010 YTD)
Top Commodities Exported (2010 YTD)
- Capacity Calculation = port transhipment + import + export + empties- Automotive forecast is conducted in tons. Conversion to units is as follows:
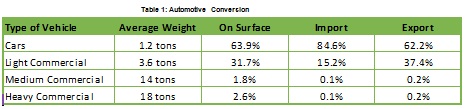
Table 1: Automotive Conversion
Corrective measures have been applied to forecasting measures done in 2007/08. Growth has been affected by the world recession, thus infrastructure in most instances has been developed too ahead of demand. A moderate and balanced approach to mitigate against (low and high) growths has been to merge the short term fluctuation in the growth of the economy with the long term 30 year forecast.
Of importance to note is the unique grouping of cargoes used in South Africa vs. those in Europe. Instead of a 62 commodity system, SA utilises a 92 commodity system. This is best observed in projected bulks (break, dry and liquid). To achieve better comparability total volumes per cargo are proportionally distributed across the port system. In the following graphs there is SA Ports imports (based on 62 commodity system) vs. NPA SA imports adjusted according to NPA type split.
IMPORTS: SA Ports

Table 2: Import for all SA Ports 2007-2037
IMPORTS: Adjusted to NPA SA Ports
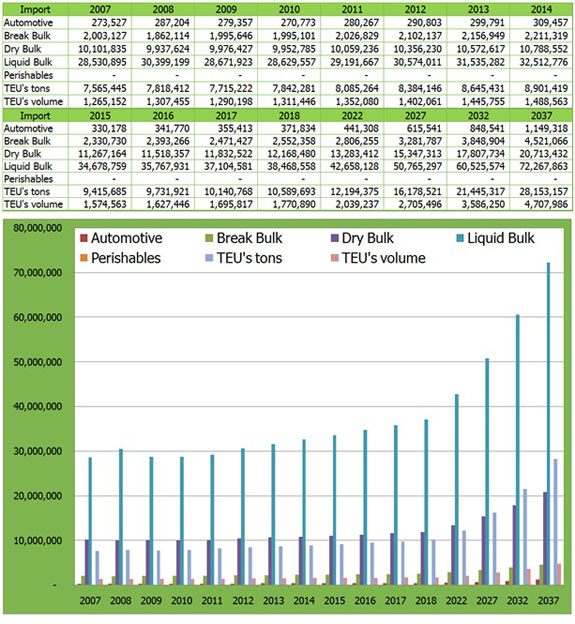
Table 3: Import for all SA Ports 2007-2037 (adjusted to NPA type split)
OBSERVATIONS: More deviations exist between break-bulk compared to dry bulk and liquid bulk on the NPA system, while dry bulk is higher. The totals for import and export per Port are comparable. Only the split of the three package type is significantly different. (Source: NIP - Transnet Capital Projects 2010)
EXPORTS: SA Ports
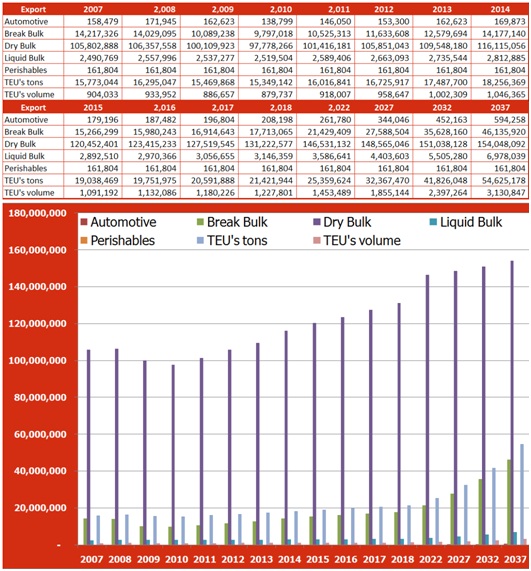
Table 3: Export for all SA Ports 2007-2037
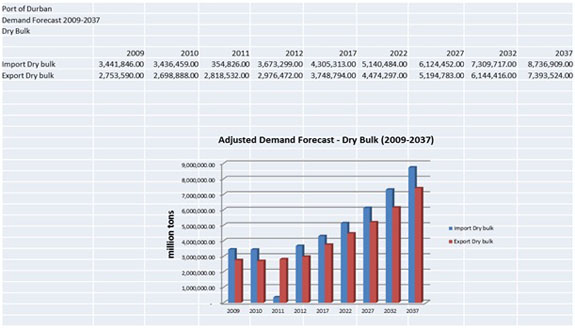
OBSERVATIONS: Dry bulk cargoes projected growth and movement is dependent on Transnet Freight rail expansion program, i.e. coal and iron ore, etc. will be capped at tons that can met by TFR. It"s important to note that these volumes are dependent on international markets and price.
EXPORTS: Adjusted to NPA SA Ports
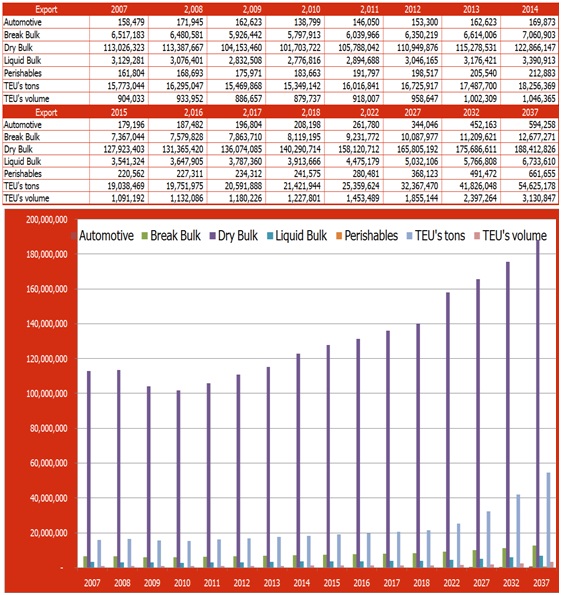
Table 4: Export for all SA Ports 2007-2037 (adjusted to NPA type split)
OBSERVATIONS: Within the bulk split, break bulk is less by 33,458,649 tons compared to SA ports while dry bulk is higher by 34,364,734 tons in NPA adjusted projections.
Port Forecasts per package type adjusted to NPA type split
Port forecasting of imports is derived from a proportional adjustment to NPA's grouping of commodities. The applied formula to adjust the tonnages is: Type of Bulk NPA / Total Bulk NPA * Total Bulk US = Type Bulk US; and applies to all three package type. The output is a redistribution of the Total Bulk of Stellenbosch proportional to the three package types of NPA.
Three areas not redistributed are: Automotive, TEUs and Perishables. These already form the NPA commodity grouping.
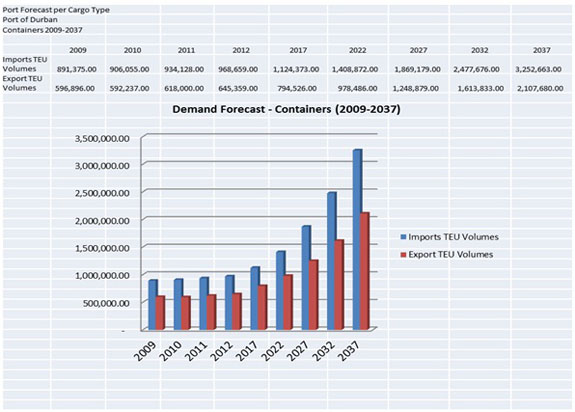
Table 5: TEU in Volumes per port
Automotive
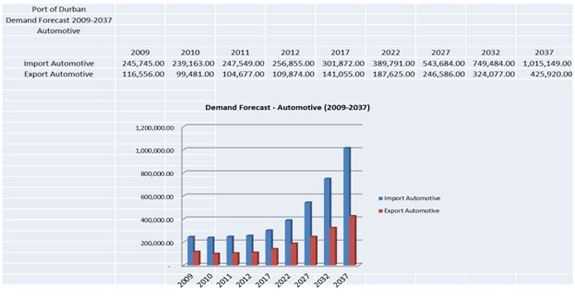
Figure 3: Automotive in tonnage per port
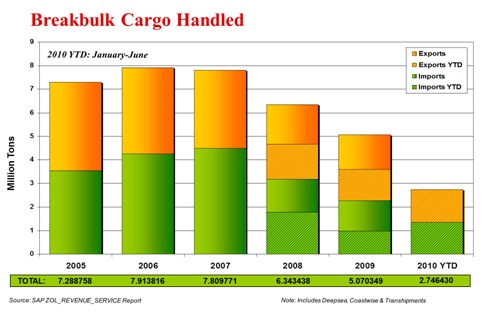
Break Bulk
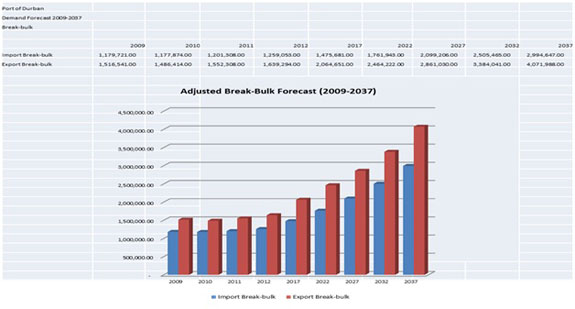
Figure 4: Break Bulk in tonnage
Dry Bulk
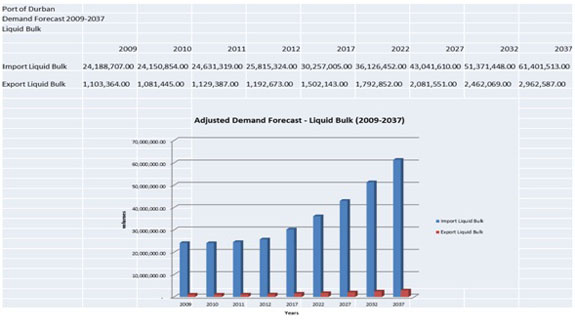
Figure 6: Liquid Bulk in tonnage per port
Perishable
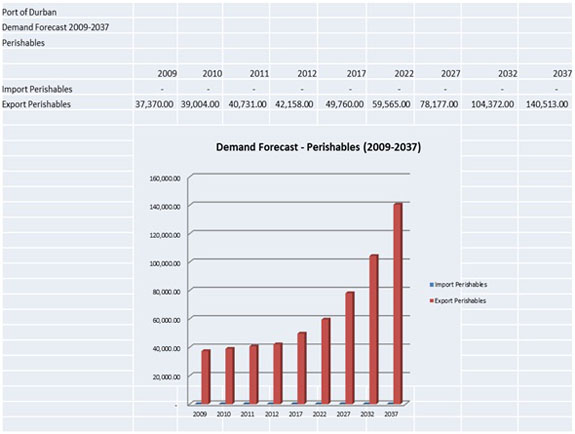
Figure 7: Perishables in tonnage per port
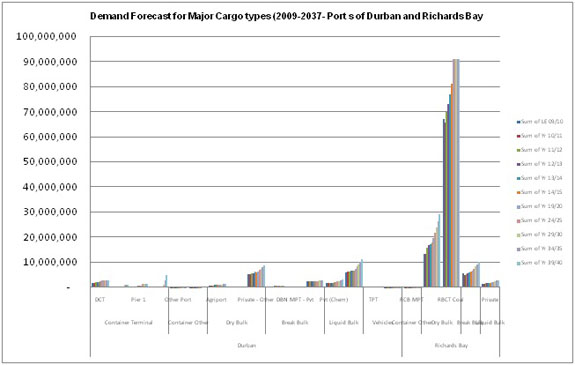
Demand Forecast for Major Cargo Types (Richards Bay and Durban) 2009-2037
The port of Durban continues to play an important role within the regeneration and competitiveness of the national and regional economy. In this regard, the Port Authority has a mandate to ensure that infrastructure is developed ahead of demand with critical performance measures for greater productivity and producing a consistent rate of return.
What can be observed at the port is that operational challenges and market forces play a determinant factor to the ports ability to meet targets set by either the broader Transnet machinery and/or stakeholders such as cargo owners, the city and the State. The balancing act required to meet some of these expectations can produce frustrations from all quarters, but what is of importance is to embrace the unique stature the port has in the region and in Africa as a whole. Secondly, international markets due dictate supply and demand of some key goods moving through the port; i.e. the global troubles of the auto industry have resulted in a decline of 24% of auto units overall in 2009/2010 in the port; container volumes have dropped by 4.5% during the same period, despite the spikes observed due to the FIFA World Cup. Mostly felt at the port was the strike that derailed some business in the area, as far as Gauteng Province. This is a testament of the commercial role the port has nationally and regionally.
In conclusion, cargo volumes will steadily increase overtime as reflected in the national demand forecast where an optimistic average growth of 11.3% is anticipated over the next +/-30 years. Tons/per car are anticipated to have a growth factor of 1.5% during the same period (this demonstrates a less than healthy outlook for the industry at large.) For other commodities like break-bulk, anticipation is for continued steady growth, maybe not as healthy as what 2009/2010 registered at 12%....but this could remain steady at this growth with an additional 2-3% increase as more dry-bulk cargo migrates to being handled as break-bulk and some migrates into containerization.
Copyright © 2010 Mpumalanga Province Freight Transport Data Bank [ - ]
All rights reserved.
This website conforms to W3C Standard [ - ]