

Port Maputo has come out as a success story of a post-conflict country and the challenges of “rebuilding” and creating economic development opportunities for national recovery. The port covers an area of approximately 129 hectares with 3,000 meters of quays ranging in depth from 8 to 12 meters.
The port and the Maputo corridor are discussed as a singular system since the success of one reflects on the other. This logistics freight highway (provincial M4 and national - N4); rail network; and better designed and operational cross-border has facilitated the port’s redevelopment and better performance than originally envisaged at the beginning of the concessioning process in 2003. As of 2006 the port under the management and operations of MPDC, handled over 6.5 million tons of cargo and had 690 vessel arrivals, out-performing comparable ports of PE, Cape Town and East London during the same period.

Map 2: Aerial View of Port Maputo Source MPDC-Port Master plan 2009
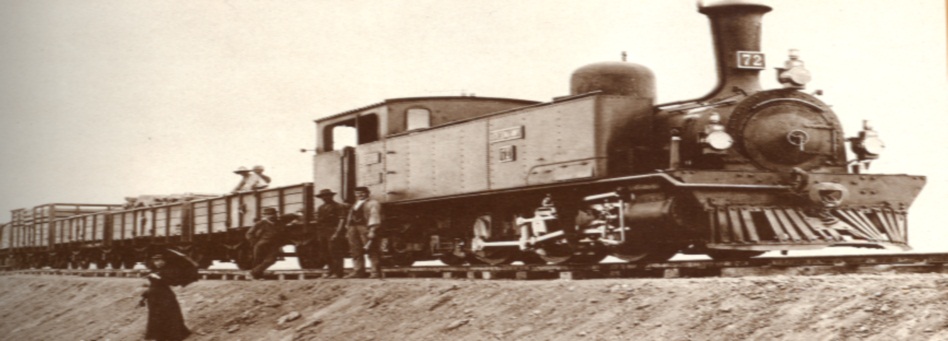
Historical Development
The great natural harbour of Maputo (Delagoa Bay) was discovered by Vasco da Gama in 1498 and lies on the sheltered estuary of Rio Espirito Santo in southern Moçambique at Longitude 32° 34' E and Latitude 25° 58' S4.

Map 3: Port Maputo early 1800s Port Maputo Webpage 2009
A high-level Historical background to port development is as follows:
- 1850s Port initial development arose from Portuguese fortress along the bay.
- 1876-1887 - Portugal re-focused on removing marshes when “Transvaal” was emerging as a key trade centre and eventually in 1887 Port Maputo was made into capital City (Lorenzo Marques)
- 1971 17 million tons of cargo handled at the port. Even at this time the port was a key “transit” cargo port for South African trade.
- 1975-1990 Civil war break-out. In 1987, only 750, 000 tons moves through the port (mostly agri-products and citrus)
- 1992 Destabilization ends
- 2000-2003 R24 million earmarked and spent building the Maputo Development Corridor. Additional funds of USD 61 million invested in port facilities by MPDC. Commencement and finalisation of negotiations Port Management Concession with MPDC for a 25 year agreement.
- 2008 Port Maputo is privatised under MPDC Management

Graphic 1 -- Historic Cargo Throughput (1971-2003)
Commercial Role of the Port and Strategic Fit
Port Maputo before 1975 handled over 17 million tons of cargo; and today it is climbing the steep hill to regain its strategic role as a transit-cargo port of countries such as Swaziland, South Africa, Zimbabwe and Botswana. With the Maputo Development Corridor and the continued improvements on the rail and road side, confidence in the port is demonstrated by the increased clientele between 2007 and 2009 which went from 5 to 11 main transit operators.
Further investments by MPDC in the last three years and those planned between 2010 to 2030 as indicated in the Port Master Plan, make its collaboration with South African ports and economic development for the region that much more realist and sustainable. Currently the port provides an alternative for commodities such as the Auto (companies based in Gauteng) and numerous mining (magnetite; chrome, etc.) and paper producers like Sappi to use the port’s less congested facilities for Asian markets. In the future the pronounced increase of trade between China, Asia and India for raw-materials makes the port an attractive stop for east-trade routes. In conclusion, port Maputo is Africa's nearest port-entry to the increased Asian market trade for provinces such as Limpopo, Mpumalanga and Eastern-Gauteng.
Location
Port Maputo lies on the sheltered estuary of Rio Espirito Santo in southern Moçambique at Longitude 32° 34' E and Latitude 25° 58' S6. The port is currently operating under MPDC management, operating two key terminals (Maputo and Matola Bulk). The approach channels to the port have been dredged to a designed depth of -9.4. Security measures have been re-introduced ISPS codes have been implemented. Inland rail and road traffic has improved and tugs and equipment have been purchased.

Plan 1: Port Maputo Layout 2015 Source Port Maputo-Master plan 2010

Plan 2: Port Layout 2025 - Source Port Maputo 2009

Plan 3: Port layout 2030 - source Port Maputo 2009
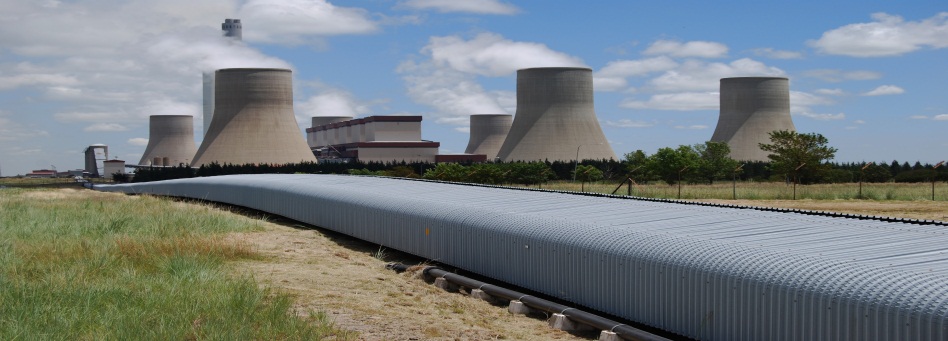
The most important function for inland infrastructure (road and rail) allows for access to freight platforms such as terminals, intermodal facilities as well as better movement of goods to the quay. In most ports, conveyor belt systems also form aspects of inland infrastructure as they facilitate movement of dry-bulk commodities such as coal, iron ore, etc.
In addition, waterside infrastructure inclusive of terminals, quays, berths etc. form a critical element for port capacity determination and efficiencies.
Landside Infrastructure
Road Network
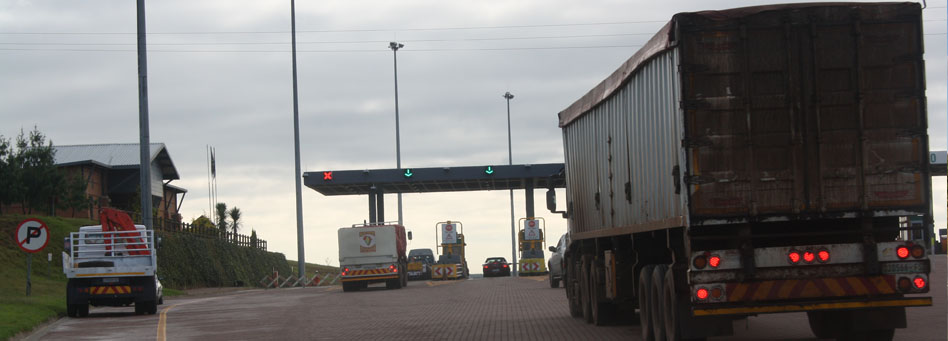
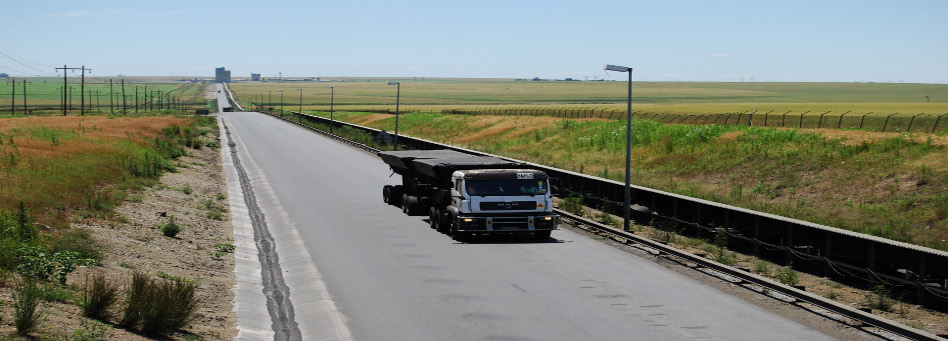
At the new entrance, the Port is now linked by a 1.3 k road which provides access to South Africa’s road network, namely, N4.this translates to about 550 km from Maputo to Gauteng. The N4 toll road7 from east Tshwane (Pretoria) is 503 km. Through this road network additional external access extends to Swaziland, Limpopo and Zimbabwe.

Photo 2: Port Entrance today - Source Port Maputo Webpage 2010
Finally, the benefit of the new port access road is that it carries heavy road traffic by-passing downtown Maputo public/city traffic and connects the harbour direct with the M4 Highway running 600km westwards through the industrial and mining heartlands of South Africa.

Map 5: N4 Toll Road Source: TRAC 2010
In the future (2015 - 2030) to ensure better logistics movement, capacity of 500 trucks per day will be planned vs. current handling of 320 trucks per day.

Graph 1: Total Projected Truck Traffic in the port - Source: Port Maputo 2009
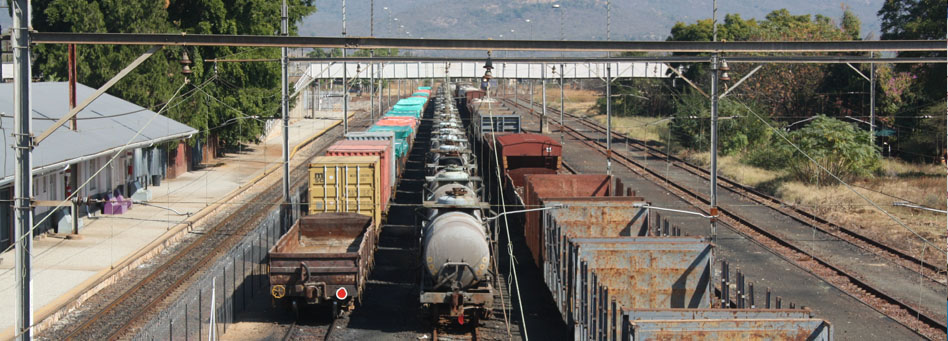
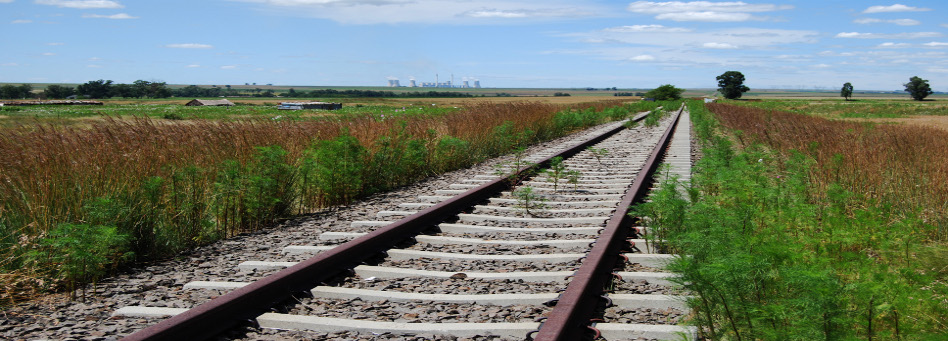
Rail Network
Work on upgrading the main line to South Africa, creating capacity for 13 million tonne per annum by 2010 is now in progress. In addition, the main line to central Zimbabwe has been rebuilt with generous American assistance and now offers 5 day transit times between Bulawayo and Maputo.

An international consortium led by NLPI, (New Limpopo Bridge Project Investments), together with Transnet Freight Rail (TFR) and CFM, the national rail operators of South Africa and Mozambique respectively, have signed a 15-year Concession Agreement to privatise the railway from the South African border through to the ports of Maputo and Matola.
The new Ressano Garcia Railway Company will invest approximately US$10 million to rehabilitate the railway line, modernising and improving it to the same standard as the South African network and providing a seamless rail link along the Maputo Corridor. The company has projected that freight traffic will increase from 2.9m tonne per annum to more than 6.8m, and feasibility studies for electrifying the line will be carried out if justified by future volumes. The company’s interim management team is already in place and the concession is expected to become fully operational during July-August 2003. Maputo and Matola are also served by cross-border rail services to and from Swaziland and Zimbabwe.

Graph 2: Projected Rail Demand 2010-2030
Waterside Infrastructure
Marine Operations
Port Maputo has two modern Z-Peller tugs each of 27 tonne bollard pull. Depending on weather conditions, pilots embark by fast semi-rigid cutter or harbour tug. Mariners can use either of the two channels for reaching the Pilot Station at Buoy 6; the North or South Channel. The South Channel saves about 11 miles for vessels arriving from South African ports, but this channel is subject to strong tidal sets and Masters are advised to check with the port authority before use. Channels and shoals are marked with buoys and beacons. Pilotage through the Xefina and Polana channels into the berths is compulsory from Buoy 6.

Map 6: Navigational Aids at the Port - Source Port of Maputo webpage 2010
Quay (Infrastructure) Profiles

Port Facilities
The port contains two distinct land use areas for terminal development and operations: Maputo Container Terminals and Matola Terminals. These two areas have working cargo terminals handling a variety of commodities ranging from containers, magnetite, ferrochrome, citrus, bagged sugar and coal, to name but a few. In addition, the port has a small dry dock, and mobile welding and repair services are available at all berths. Diver services are also available.
Port Terminals
Port Maputo Cargo Terminals operates on a 24 hours a day covering an area of seven hectares. Berth profile is 300 meters with depth of 11 meters. The container terminals handle containerized cargoes of fish products, rice, sugar, fruit, construction materials, and vehicles as well as a variety of other goods. The terminals have capacity to handle 100 thousand TEUs per year, with 68 reefer plug points.

Diagram ----Port Terminal Orientation - Source: Port Maputo Webpage 2010

Diagram --: Maputo Cargo Terminals - Source Port Maputo - Yearbook 2008
OPERATOR: MPDC
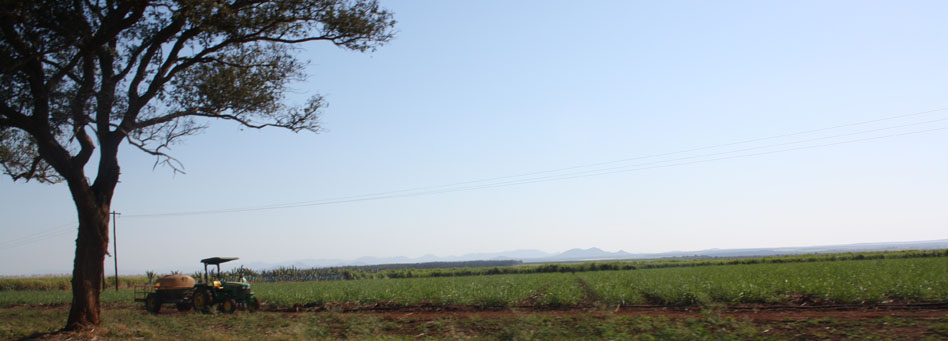
- Citrus Terminal handles fresh produce and citrus fruits at a wharf with two berths of a total length of 380 meters with alongside depth of 11 meters. The terminal includes a pre-cooling store with four chambers and capacity for 3200 pallets.
- Bulk Sugar Terminal handles raw bulk sugar at a 170-meter long berth with alongside depth of 10.5 meters. The terminal includes one sugar store with capacity for 45 metric tons and two sugar stores with capacity of 40 thousand metric tons each.
- Molasses Terminal in the Port is dedicated to handling bulk molasses and has a dedicated pipeline connecting the wharf with storage tanks. The berth is 179 meters long with alongside depth of 10.5 meters. Two storage tanks have capacity for nine thousand metric tons of cargo, and two storage tanks have capacity for six thousand metric tons.
- Coastal Terminal handles containers, logs, vehicles, and general cargo. With three berthing positions of a total 300 meters and alongside depth of 8 meters, the terminal contains open area of 15 thousand square meters and warehouses of five thousand square meters. The terminal also has mechanical and carpenters shops and the only container maintenance and repair station in Mozambique.
- Bagged Sugar Terminal handles containerized exports at a 200-meter-long berth with alongside depth of 10.5 meters. It includes a transit storage shed that specializes in handling that cargo. Cargo is moved in 25-bag sling units on forklift trucks. The capacity of the shed is storage of five thousand tons of cargo. Container-packing capacity is 24 boxes per day.

Diagram ------Matola Bulk Terminals - Source: Port Maputo MPDC Yearbook 2008
OPERATOR: MIPS
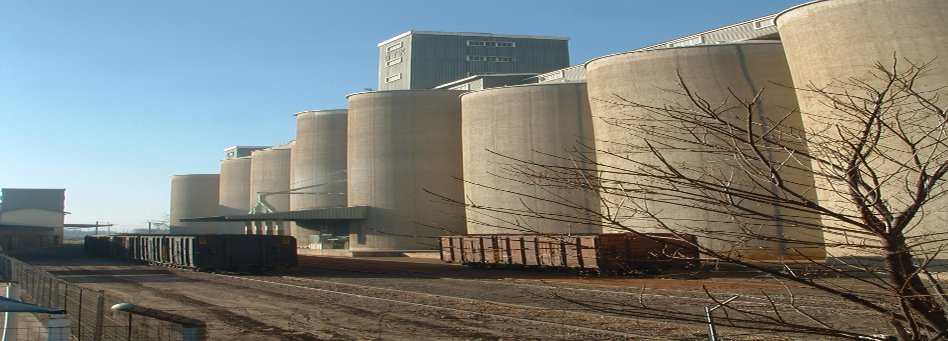
- Matola Bulk Terminals handle a variety of cargoes (mostly export and manufacturing industries the Oil terminal and new Mozal Aluminium Terminal). With berthing position of 210 meters with depth of 9.5 meters, the Grain Terminal has capacity for 400 thousand tons of bulk cereals or soya bean meal per year. It can store up to 30 thousand tons of cargo and has mooring dolphins that can unload 250 tons per hour and load or unload bulk in rail-cars at 100 tons/hr.
- Aluminium Terminal can handle one million tons of bulk alumina, petroleum coke, or pitch per year at its 210-meter berthing position with alongside depth of 12.6 meters.
- Petroleum Terminal, Fuel Terminal 3 has a berth of 230 meters with alongside depth of 10.5 meters, and it can handle 350 thousand tons of light and heavy fuels and mineral oil products per year. It has an independent quay with mooring posts and mooring dolphins.
- At 205 meters long with depth of 10.5 meters, the Maputo’s Coal Terminal can handle 2.5 million tons of bulk mineral coal per year. The terminal contains bins/storage area for about 360 tons of coal and has water available for vessels.
Containers Handled 2001-2009

Figure 4: Port Growth: Cargo volumes and Vessel Arrivals (2002-2009)


Introduction
The role of a Port is to facilitate economic development for the country and/or the immediate economic region. This is may be achieved through international trade i.e. the import and export of goods. Ports provide the necessary facilities and infrastructure to make international trade possible, especially for high volume and tonnage goods. The extent, nature and provision of infrastructure and facilities in a Port are therefore directly linked to projected cargo volume at the Port.
The basis for future infrastructure investments is driven by the growth in cargo volumes to be handled. Cargo forecasts are used to determine infrastructure capacity requirements. Additional infrastructure required is zoned to different geographical areas (precincts) in the Port based on a predetermined logic. This provides a list of independent development projects required for different cargo types in the different precincts. The programming of development projects is dictated by the rate of cargo growth with each project having an associated cost to inform investments required in the Port, and the financial viability models and economic impacts.
Cargo types in the port ideally consolidated and categorised into the following main groups:
- Containers
- Vehicles
- Bulk Liquid
- Dry Bulk, and
- Break Bulk
Capacity studies undertaken for each of the above cargo types individually then inform the overall capacity per cargo type with financials associated.
Forecasting Methodology
Forecast is a result of adopting a pre-determined planning cycle that attempts to predict the impact of changing global trade on port activities. Subsequent plans supported by the forecast, therefore attempt to identify capital and technology needs for expansion and modernization of the port in response to anticipated changes. The essence of the cargo forecast is to determine:
- Type and tonnages of commodities moving through the port;
- Handling method (Bulk/Break bulk/Containers/Motor Vehicles) and how these are carried as maritime cargo.
- Ship (vessel) types (bulkers/general/tankers/car carriers etc.)
This is not 100% accurate to forecast and as such there is always a high degree of uncertainty. This serves as an attempt to minimize risk that uncertainty brings; consequently forecasts are subject to review and will predictably change at five year intervals due to market forces and competition.
Forecasting Model
Past Traffic Analysis
Past traffic analysis includes the type of vessels calling at the port:
- Container Vessels
- Bulk Carriers
- Tankers
- General Cargo Carriers
- Bunker Vessels
- Other which includes navy, passenger & fishing vessels
Cargo Classification
Cargo is classified per commodity into the following categories:
- Containerized Cargo
- Motor Vehicles
- Liquid & Dry Bulk
- Break Bulk
Review of Market Influences
A review of market influences on traffic and technological trends was undertaken. The approach involved:
- A review of the global economy by specifically looking at an Overview of World Economic Outlook projection for:
- World Output
- Advanced/Developed Economies
- Emerging & Developing Countries
- A review of Maritime transport undertaken which involve:
- An analysis of development on world sea borne trade
- An analysis of development in the world fleet
- An analysis of Port Developments
- An analysis of technological developments & trends
- A review of the South African Economy, mainly:
- The performance of the Gross Domestic Product (GDP)
- The performance of exchange rates
Overall Port Projected Activity
Based on the port master plan conducted in 2008, the port development program takes into account an optimistic growth curve to the functioning and demand for port infrastructure over the next 30 years. The timeframe is 2010 to 2030 focusing on inland (rail and road) infrastructure, waterside berths, dredging and equipment) infrastructure.
This section presents the projected cargo volume throughputs within this time frame; likely impact this growth will have on infrastructure and finally how this anticipated growth will be achieved (i.e. Capex etc.).

Projected Port Throughput: 2010 - 2030
Total Top performing Commodities - 2007 exports


Graphic 2: Infrastructure Requirements influenced by Cargo growth - Source: Port Maputo - Port Master plan 2009

Projected Port Activity and impact on Infrastructure (2008-2030)
Projected Vessel Arrivals (2009-2030)

Proposed Port Development : CAPEX Investment 2015-2030 - Source: Port Maputo - port master plan 2009

Port Maputo is poised at fulfilling its long historical role as a “preferred transit” port in the Southern African region. However it is important to note that incremental growth is likely what will transpire which means “optimistic” growth curves of achieving over 48 million tons of cargo by 2030 will have to be monitored and percentage growth adjusted.
The other challenge for the port as in South Africa is the uncertainties of world economies and regional trade forces (especially in exports) as most of these economies are still heavily skewed towards “raw-material” export. Export-based markets of such cargo have healthier margins if there is critical mass of demand which drive prices up.
For the port to achieve its vision and meet its socio-economic development mandate, diversified, value-added cargoes must form the repertoire of those handled at the port. To promote more transit, completed infrastructural projects and processing systems at the border and efficiencies at the port are mandatory. Also, maintaining the collaborative partnership with ports in South Africa will go a long way towards creating an environment of complementarity, thus having a collective vision for capital investment and eliminating duplication of services. This however does not mean the port should not take opportunity when they are the better performer in meeting customer needs.
Copyright © 2010 Mpumalanga Province Freight Transport Data Bank [ - ]
All rights reserved.
This website conforms to W3C Standard [ - ]