Cacadu
Introduction
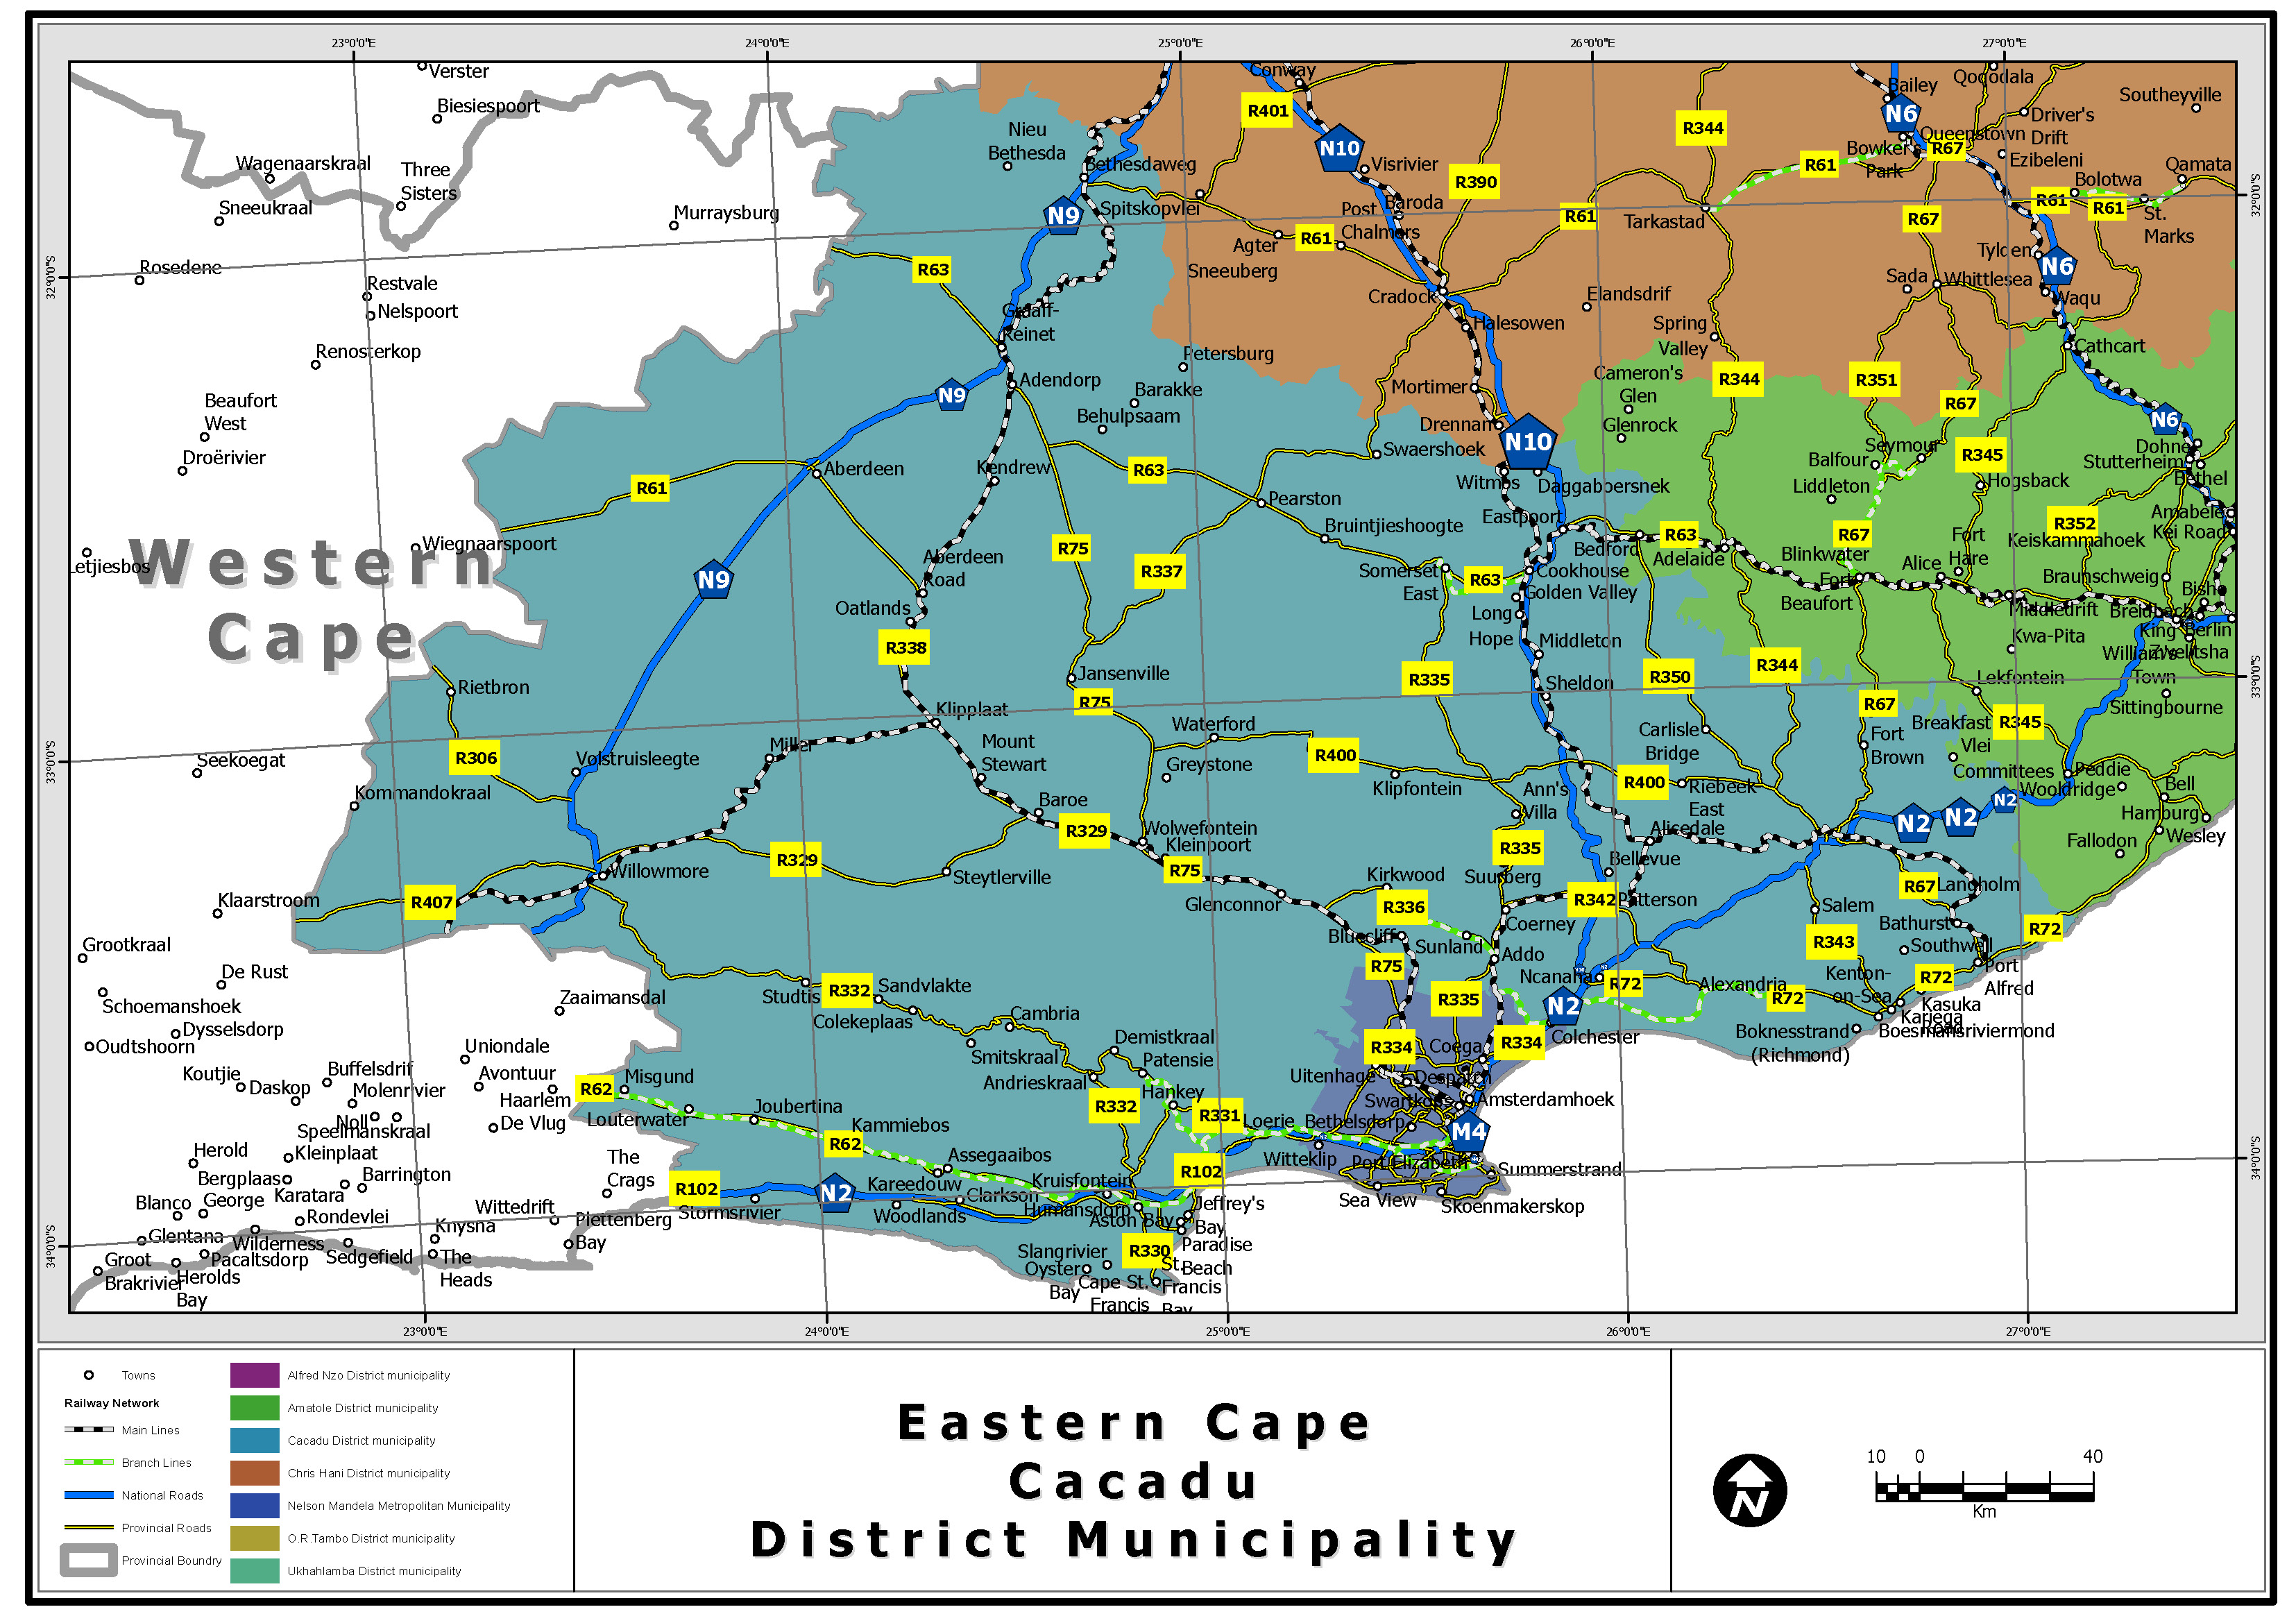
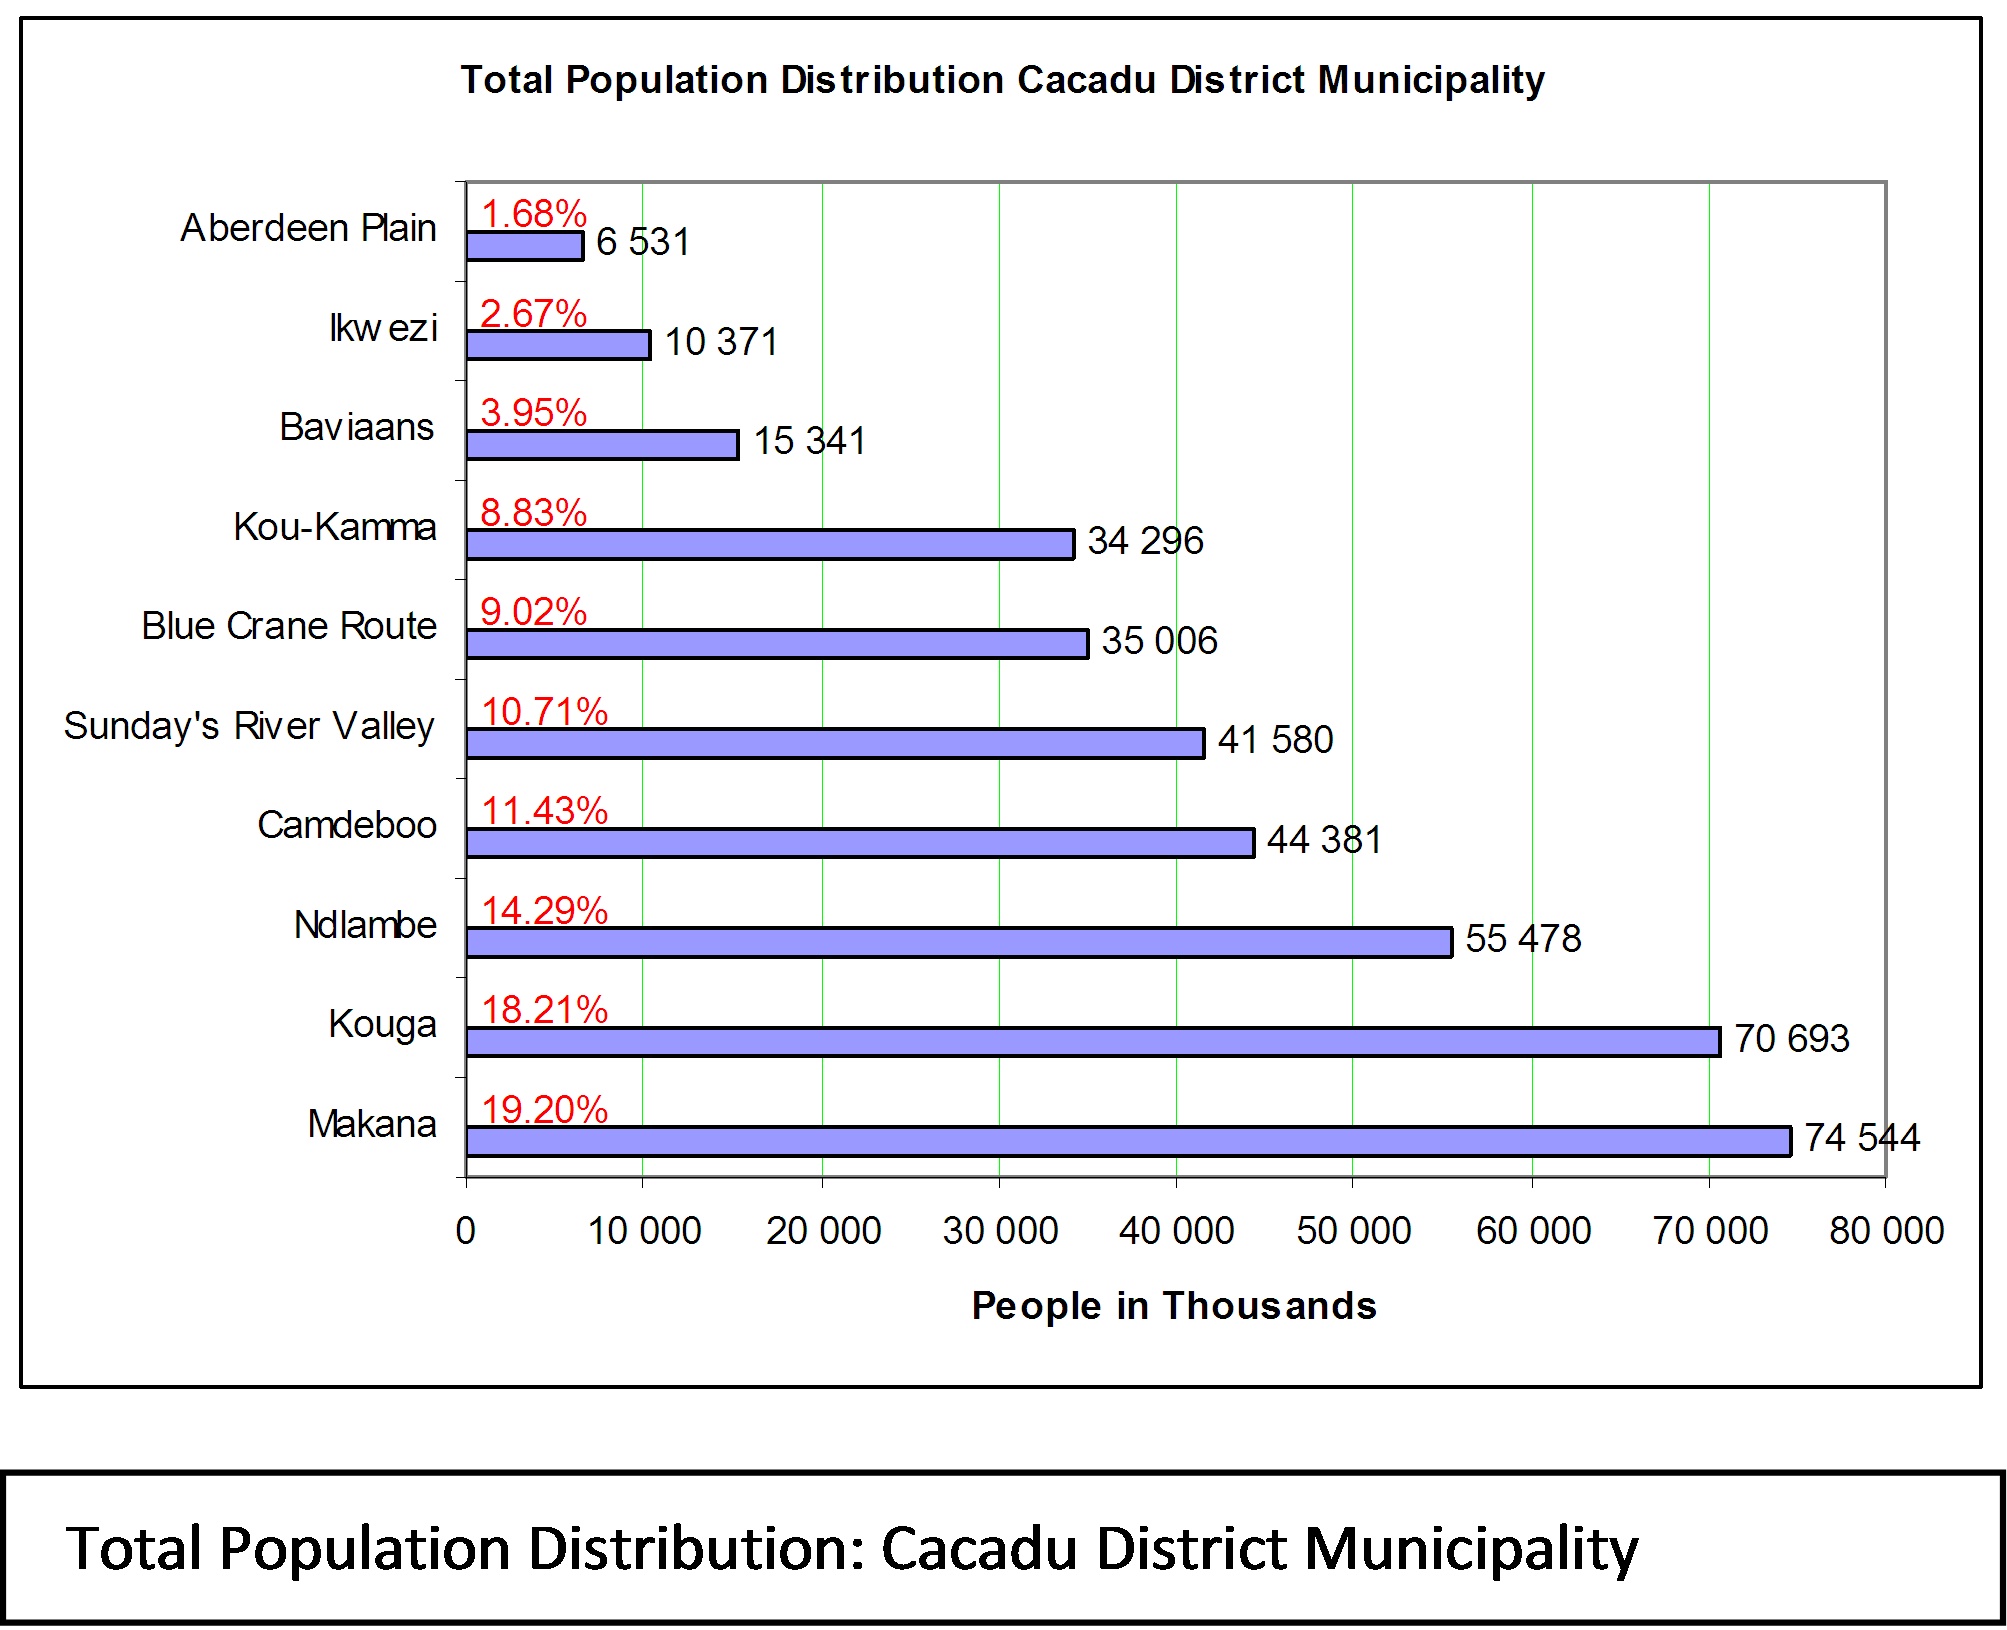
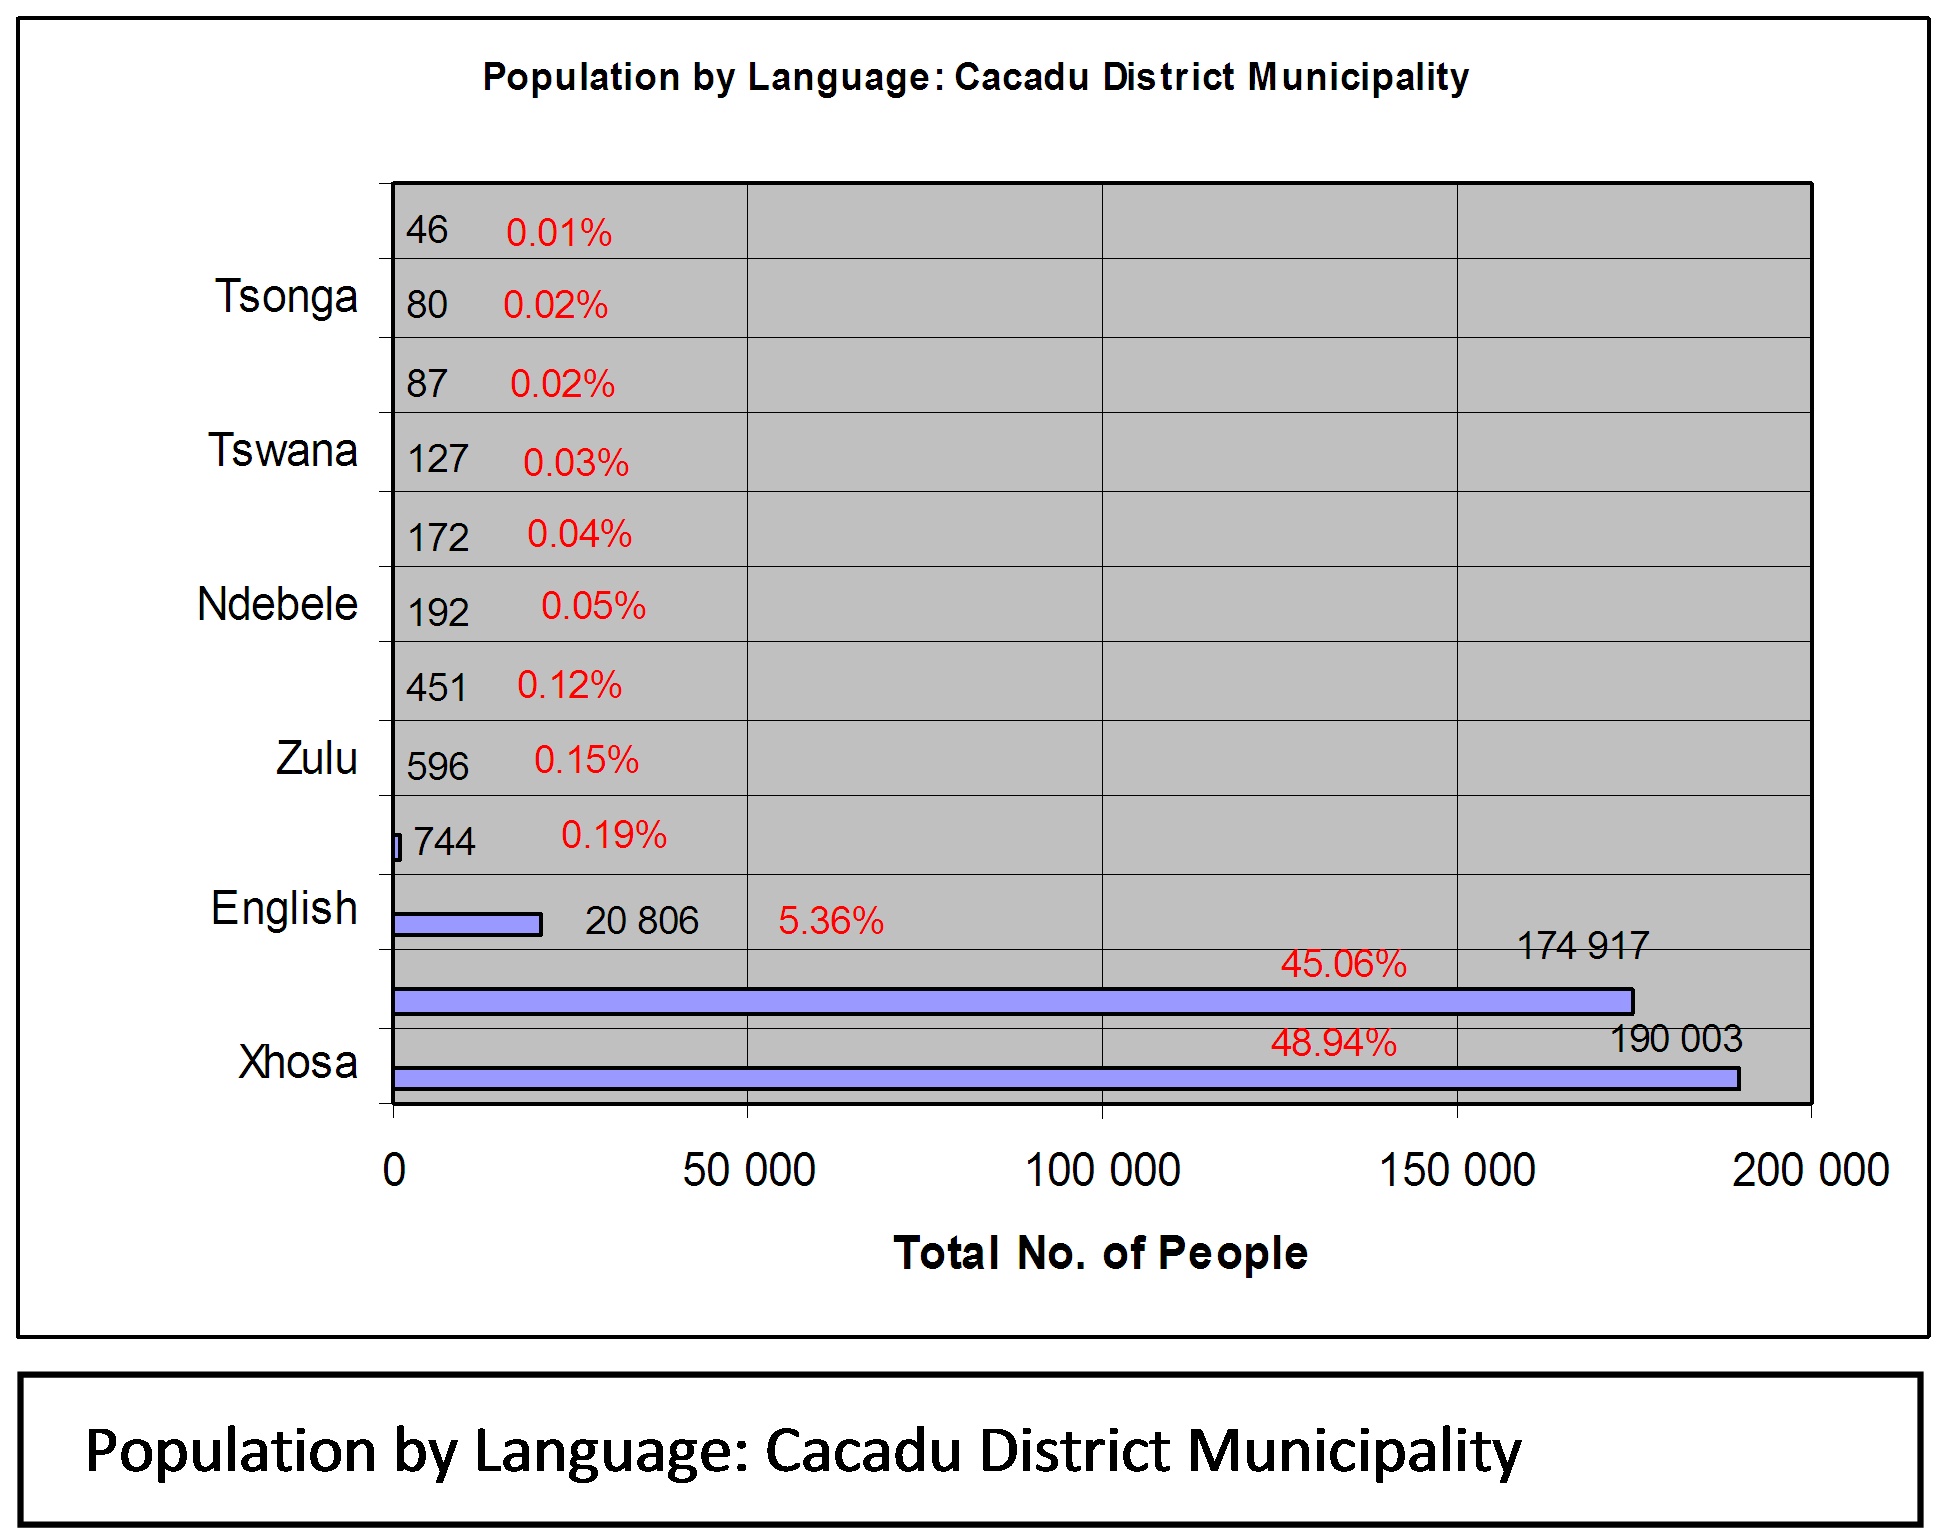
Cacadu District Municipality covers an area of 58 242 km². The name Cacadu is derived from the Khoikhoi word tkakadao, which means "bulrush river". This was an earlier name for the current Papkuils River near Port Elizabeth, and a river tributary to the northeast. Cacadu District Municipality (CDM) is situated in the Western Portion of the Eastern Cape province, covering an area of 58 242 square kilometres. In 2001, Statistics South Africa estimated the population figure in the Cacadu district to stand at a total of 388 210. Due to the Districts mainly rural, arid nature, low population densities prevail within the dry Karoo interior. Census 2001 depicts that the majority of the District’s population resides within the local municipalities of Makana, Kouga and Ndlambe. The largest languages among the 388 201 people are Xhosa and Afrikaans. (2001 Census). The figure to the right presents population distribution in Cacadu District Municipality. Cacadu is surrounded by:
The district contains the following local municipalities: Makana, Kouga, Ndlambe, Camdeboo, Sunday’s River Valley, Blue Crane Route, Kou-Kamma, Baviaans, Ikwezi and Aberdeen Plain. The district population has an even distribution with the top tier municipalities each constituting between 14-18% of the total population in the District (i.e. Makana -19.20%, Kouga – 18.21% and Ndlambe – 14.295). The middle tier municipalities each constituting between 8-11% of the total district population (i.e. Camdeboo – 11.43%, Sunday’s RiverValley – 10,71%, Blue Crane Route – 9.02%). The lower tier municipalities each constitute between 1-3% of the total population in the district (i.e. Baviaans – 3.95%, Ikwezi- 2.67% and Aberdeen Plain – 1.68%). This even population distribution has implications for traffic freight movement and challenges in the district. Just like in Alfred Nzo and Amathole District Municipality, in conducting freight business in the municipality the need to take account of the local languages for communication is important. By the same token efforts for gender empowerment in freight and BBBEE are important given the gender and ethnic composition in the Cacadu District Municipality. The table above presents population by ethnic grouping in the District.
Relative to other districts in the Province, the Cacadu district has the 2nd lowest population figure and the largest geographical area relative to other district municipalities in the Province, with a coverage of 85 242 square kilometres . The average population growth rate of CDM is 2.0% per annum. This is higher than the growth rate of South Africa (1.3%) and the Eastern Cape (1.4%). This could be partially attributable to a lower prevalence of HIV/AIDS in CDM (8.6%) than that of the Eastern Cape (9.5%), in particular, and South Africa (10.9%), as a whole.
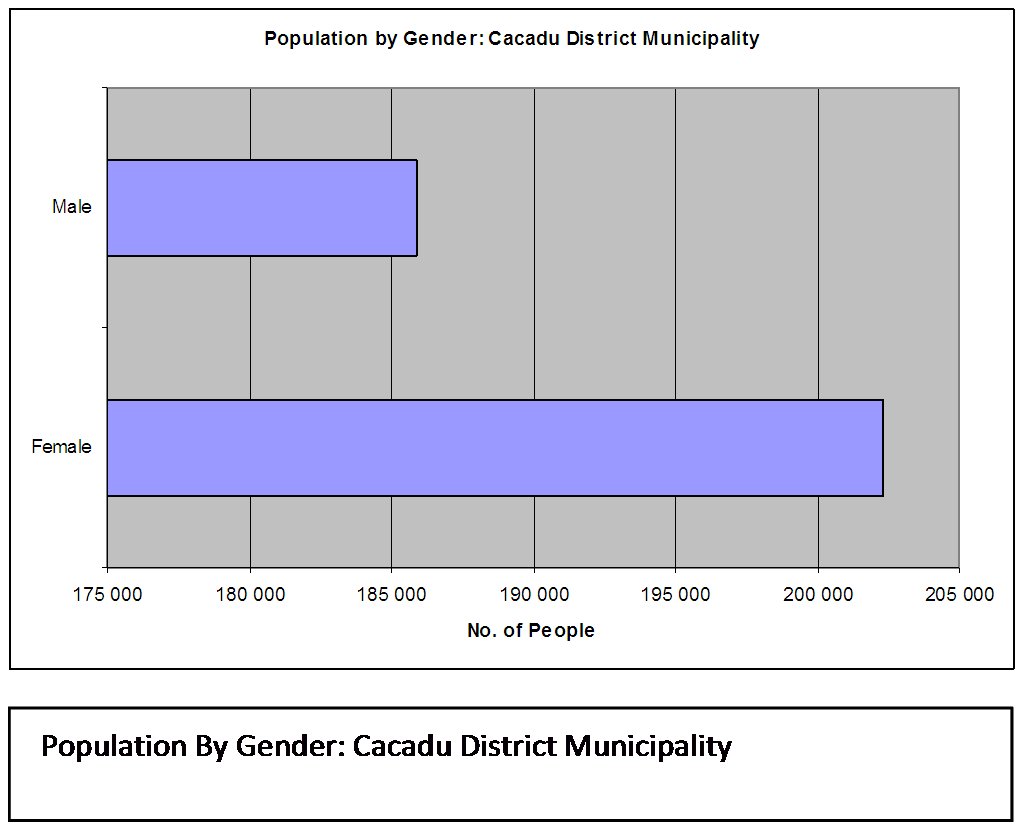
The overwhelming majority of the population (45.2%) is employed in elementary occupations. This is inextricably linked to the high number of individuals employed in the agricultural sector. The remainder of the population is employed in a variety of occupations, including, but not limited to craft and related trade workers (8.0%), skilled agricultural and fishery workers (8.0%) and service workers, shop and market sales workers (7.9%). The mining, utilities and trade sectors employ less than 5% of the population in all nine local municipalities. The PGDP advocates for a 50% reduction in unemployment in the Province by 2014. Within the Cacadu District, then, a reduction of 25% would translate into the creation of 13,000 jobs by 2014. The figure above presents the gender distribution in the district. This has implications for transport and freight empowerment and capacity building initiatives.
The District is ranked as the third largest economy within the Eastern Cape, with 9% of provincial value added. The average annual economic growth rate for the Cacadu District between 1996 and 2002 was 2.4%. Various sectors contribute to the overall economy, but the biggest employer is agriculture at 32.4% in 2002. This is unlike in other districts where the largest employer appears to be government. Employment in the agricultural sector has decreased over the period 2000 (38.3%) to 2004 (34.4%) and in 2004, 15.8% of the population were employed within the general government services sector. During the period 2000-2004, the manufacturing, construction and business services sectors each employed between 4.5% and 7.5% of the District’s population. Tourism and Environment
The District’s wide range of environmental assets is the primary catalyst behind the prevalence of the tourism industry in the District. The District is fortunate to possess within its boundaries, environmental assets that are of a national significance, namely: the Baviaanskloof Nature Reserve; the Addo Elephant National Park; and the Tsitsikamma National Park. The District is also home to several five star eco-tourism lodges.
There is however, a need to further develop and market these assets in order to exploit the tourism potential of the District as a whole. Initiatives are currently underway which will allow for the further expansion of the Addo Elephant National Park, the footprint of which will be guided by the STEP Project. Besides the tourism potential of the District, the area is generally characterised by very sensitive natural vegetation that requires protection. Fortunately, most of these areas have been proclaimed in the form of conservation areas. Pressure in the form of urbanization, along with associated infrastructural needs, however, still exists.
Agriculture
Agricultural industries play a predominant role within the District; this is highlighted by the majority of the population (in excess of 30%) being employed within the agricultural sector. The majority of the District is subject to extensive grazing for cattle and sheep. Intensive agriculture in the form of dairy and citrus farming is dominant within the southern portion of the District. Primary issues relating to the agricultural industry within the District includes the following:
Settlement Patterns
The process of colonisation within the Eastern Cape, based on the function of urban centres as either district service or administrative centres, has resulted in a network of settlements at varying levels of urbanisation ranging from rural villages to towns servicing predominantly extensive farming areas. In addition, most urban centres are characterised by functionality based on the divisional policies of the past in the form of marginalized townships. These areas have promoted sprawl due to their peripheral location, and are subsequently compromised in the form of sustainability, as inadequate linkages exist between the settlement and the core of the urban area. The Cacadu District’s development pattern is influenced by the primary structuring elements:
Nodal Development
The most significant nodal points within the district consists of the towns of: Grahamstown, which remains an important educational and cultural centre. The surrounding area is farmed, largely for chicory, pineapples, ostriches, sheep and game.
Rural Patterns of Development
The district of Cacadu is predominantly rural in nature as the existence of low and erratic rainfall, coupled with sparse vegetation, can only support extensive grazing on large farms. As a result, the majority of the District is characterised by a small rural population living in scattered towns and settlements.
Road Network Infrastructure (km)
Significant Primary RoadLinks
The District of Cacadu is characterised by a range of road types which loosely relate to their role and purpose in terms of hierarchical function, i.e. gravel roads servicing the rural / farm community while tarred trunk roads serve as linkages between established towns. Arguably the five primary inter-regional road linkages, as illustrated below, that occur within the District are as follows :
Number of Clinics
Roads
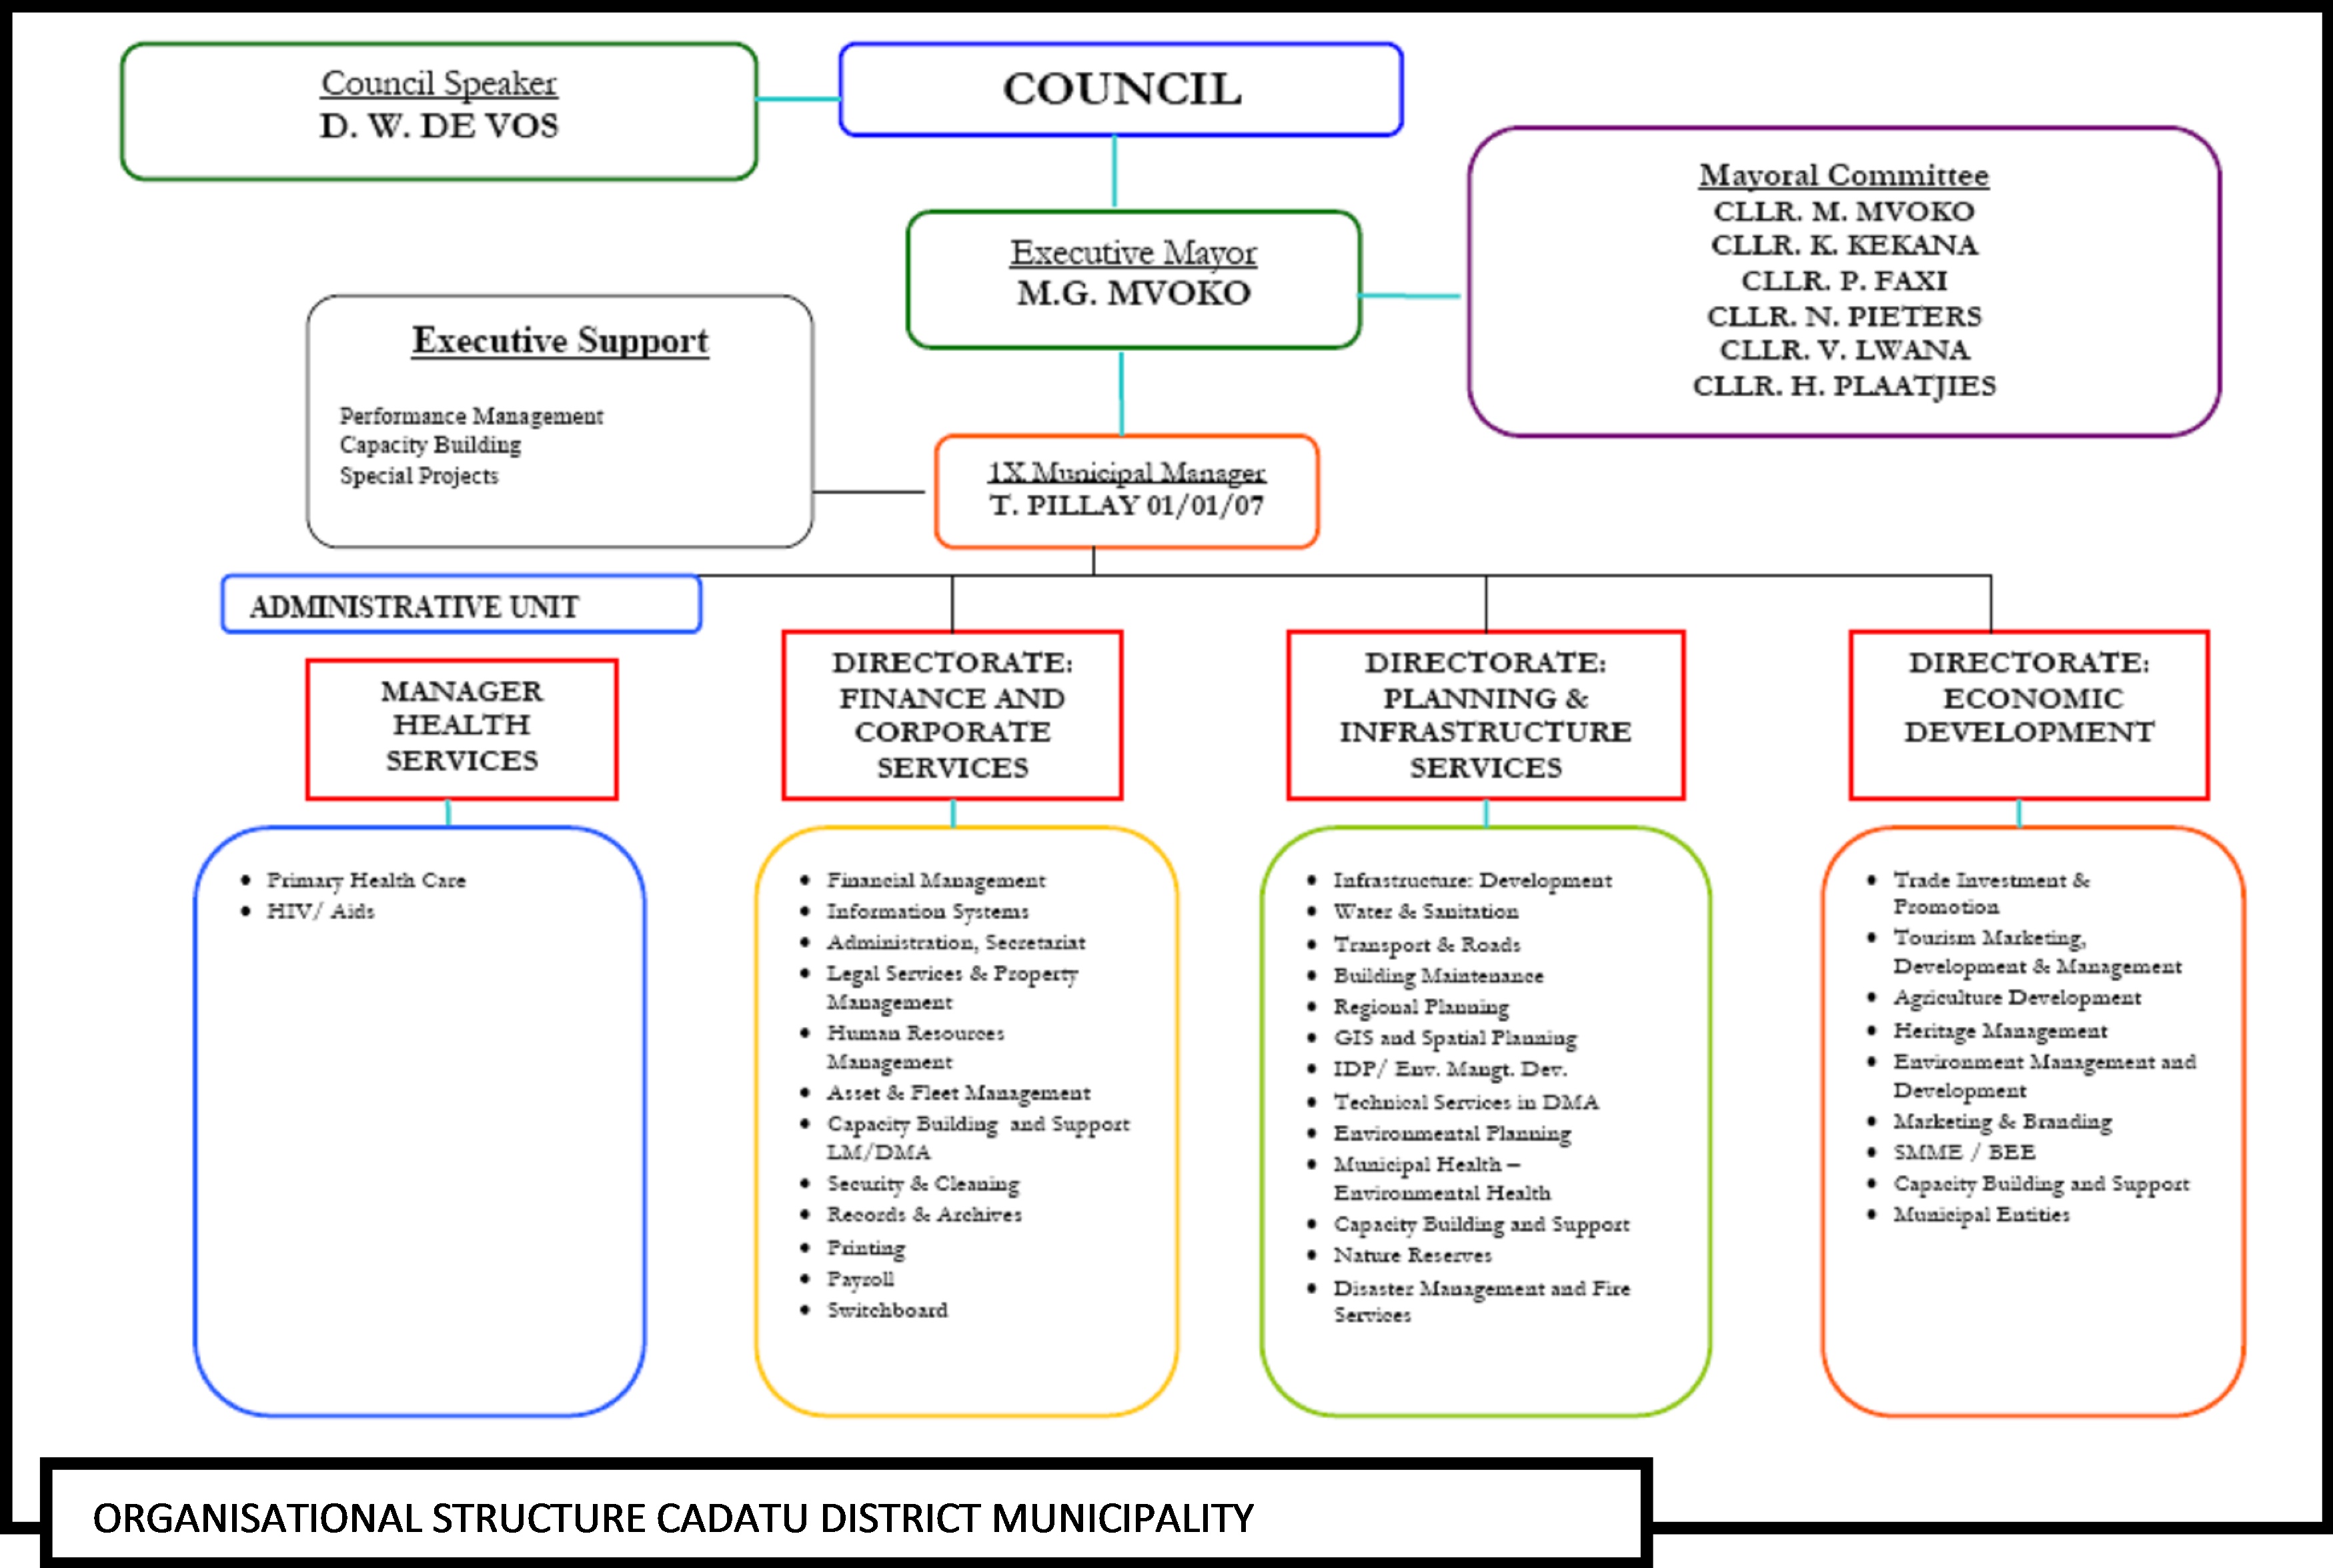
Organizational Structure
| ||||||||||||||||||||||||||||||||||||||||||||||||||||||||||||||||||||||||||||||||||||||||||||||||||||||||||||||||||||||||||||||||||||||||||||||||||||||||||||||||||||||||||||||||||||||||||||||||||||||||||||||||||||||||||||||||||||||||||||||||||||||||||||||||||||||||||||||||||||||||||||||||||||||||||||||||||||||||||||||||||||||||||||||||||