Amathole
Introduction
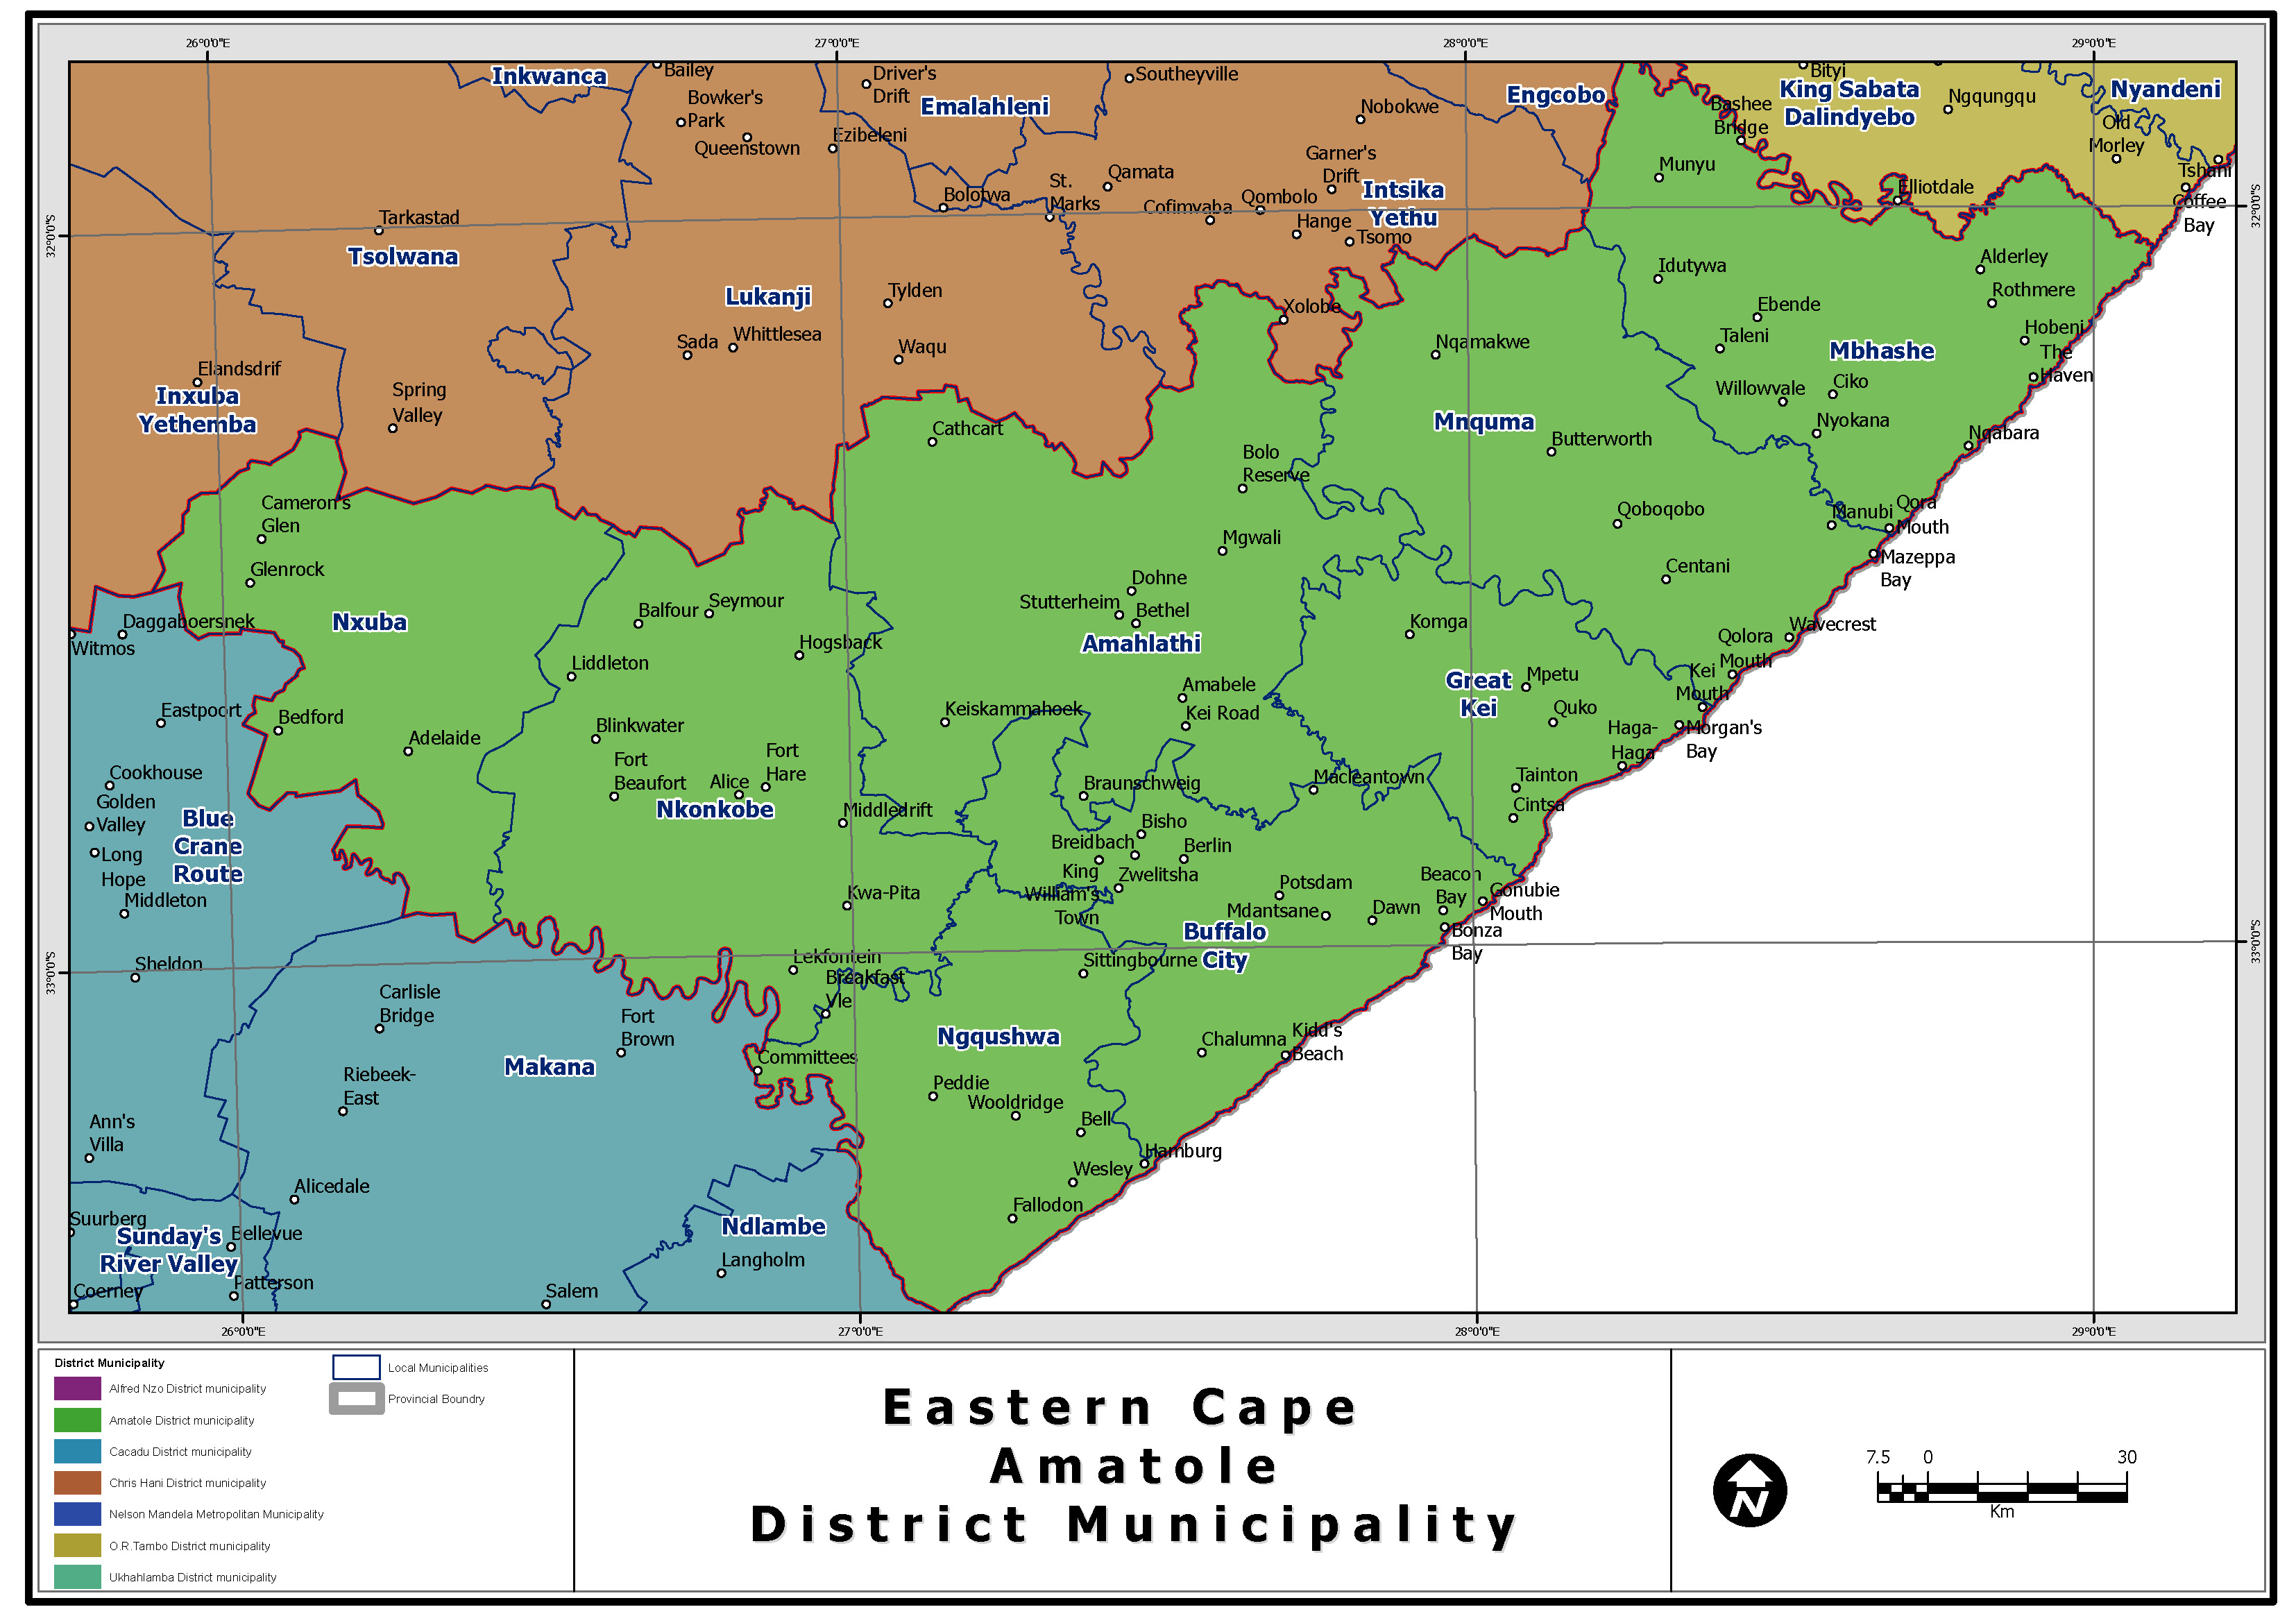
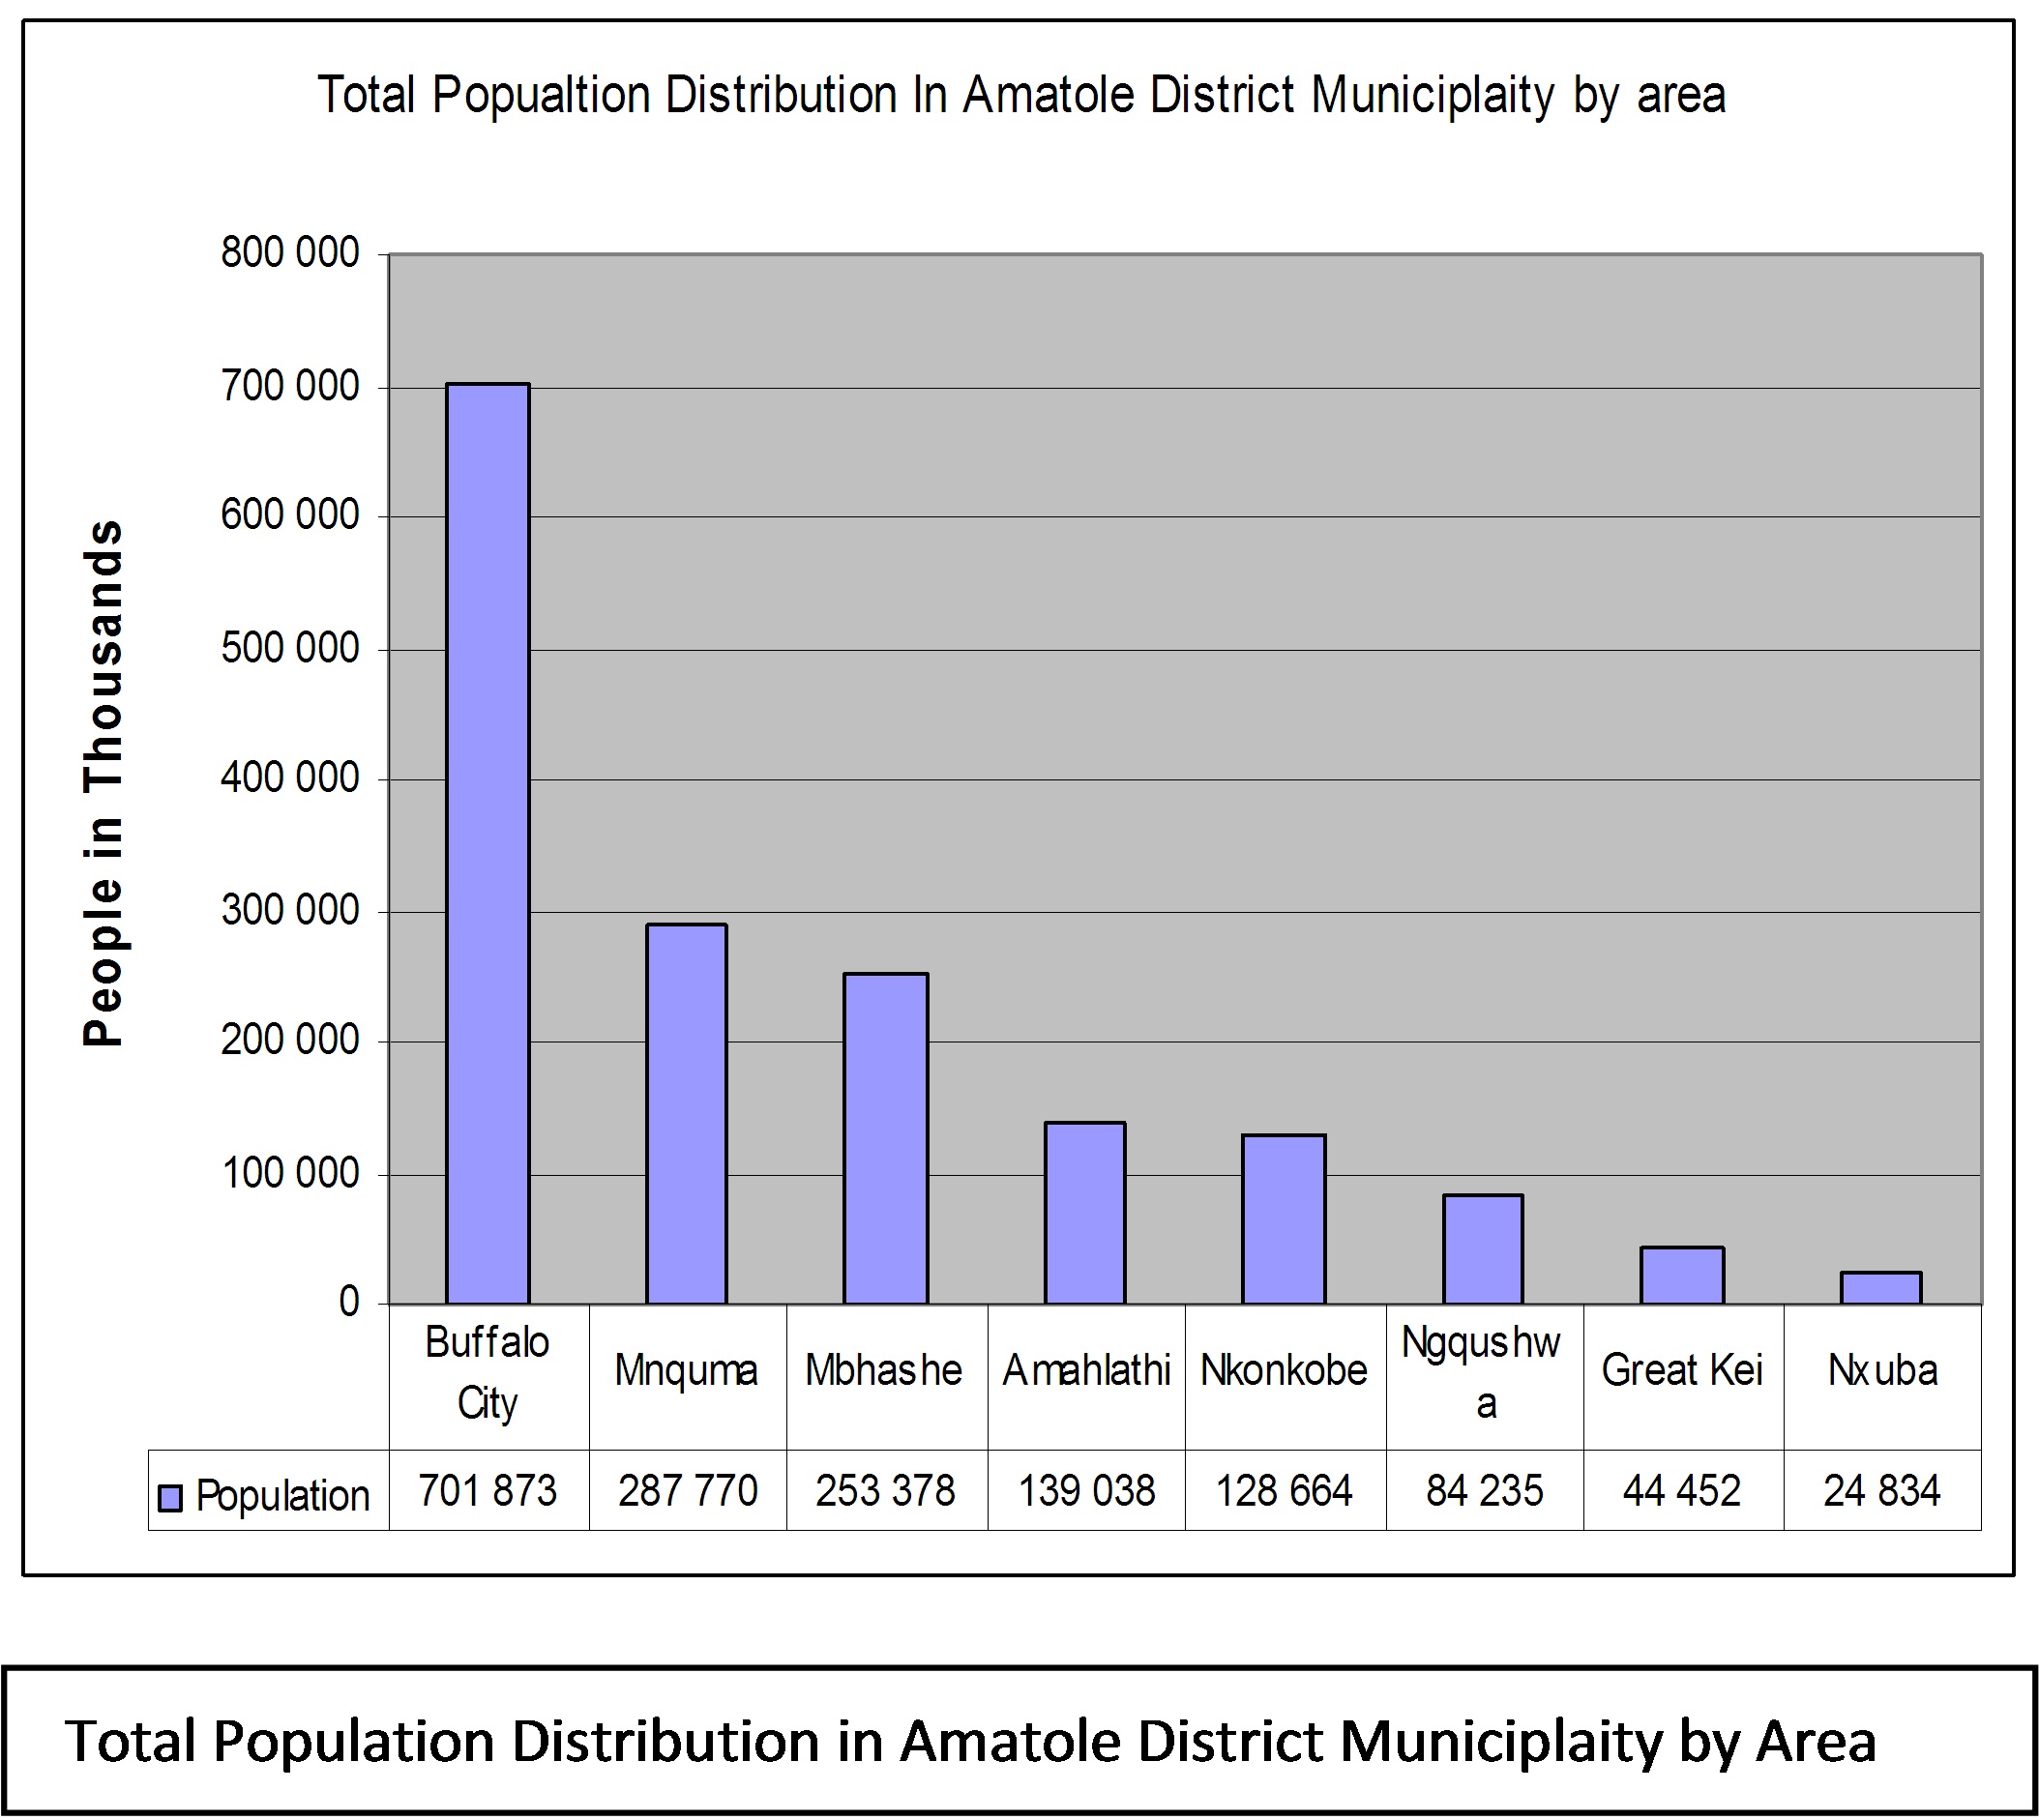
Amathole District Municipality covers an area of 1 664 259 km2. This District, with an estimated population number of approximately 1, 7 million and an average population density of 63.5 people per square kilometre, contains 25, 9% of the Eastern Cape’s total population. This varies widely across the municipalities, from 167 people per square kilometre in the urban centre of Buffalo City to six (6) people per square kilometre in Nxuba. Buffalo City is home to 42.2% of the District’s people (701 890 people) while just 1.5% of the population live in the Nxuba local municipality. The population of the District is predominantly African (92.5%). The figure above presents the population distribution by area in Amathole District Municipality. The African population of the district is largely found in the former Transkei and Ciskei areas, as well as around the urban and semi-urban centres of East London and King William’s Town. Amathole is one of the 7 districts of Eastern Cape province of South Africa. The seat of Amathole is East London. Over 90% of its 1 664 259 people speak IsiXhosa (2001 Census). Amathole is surrounded by:
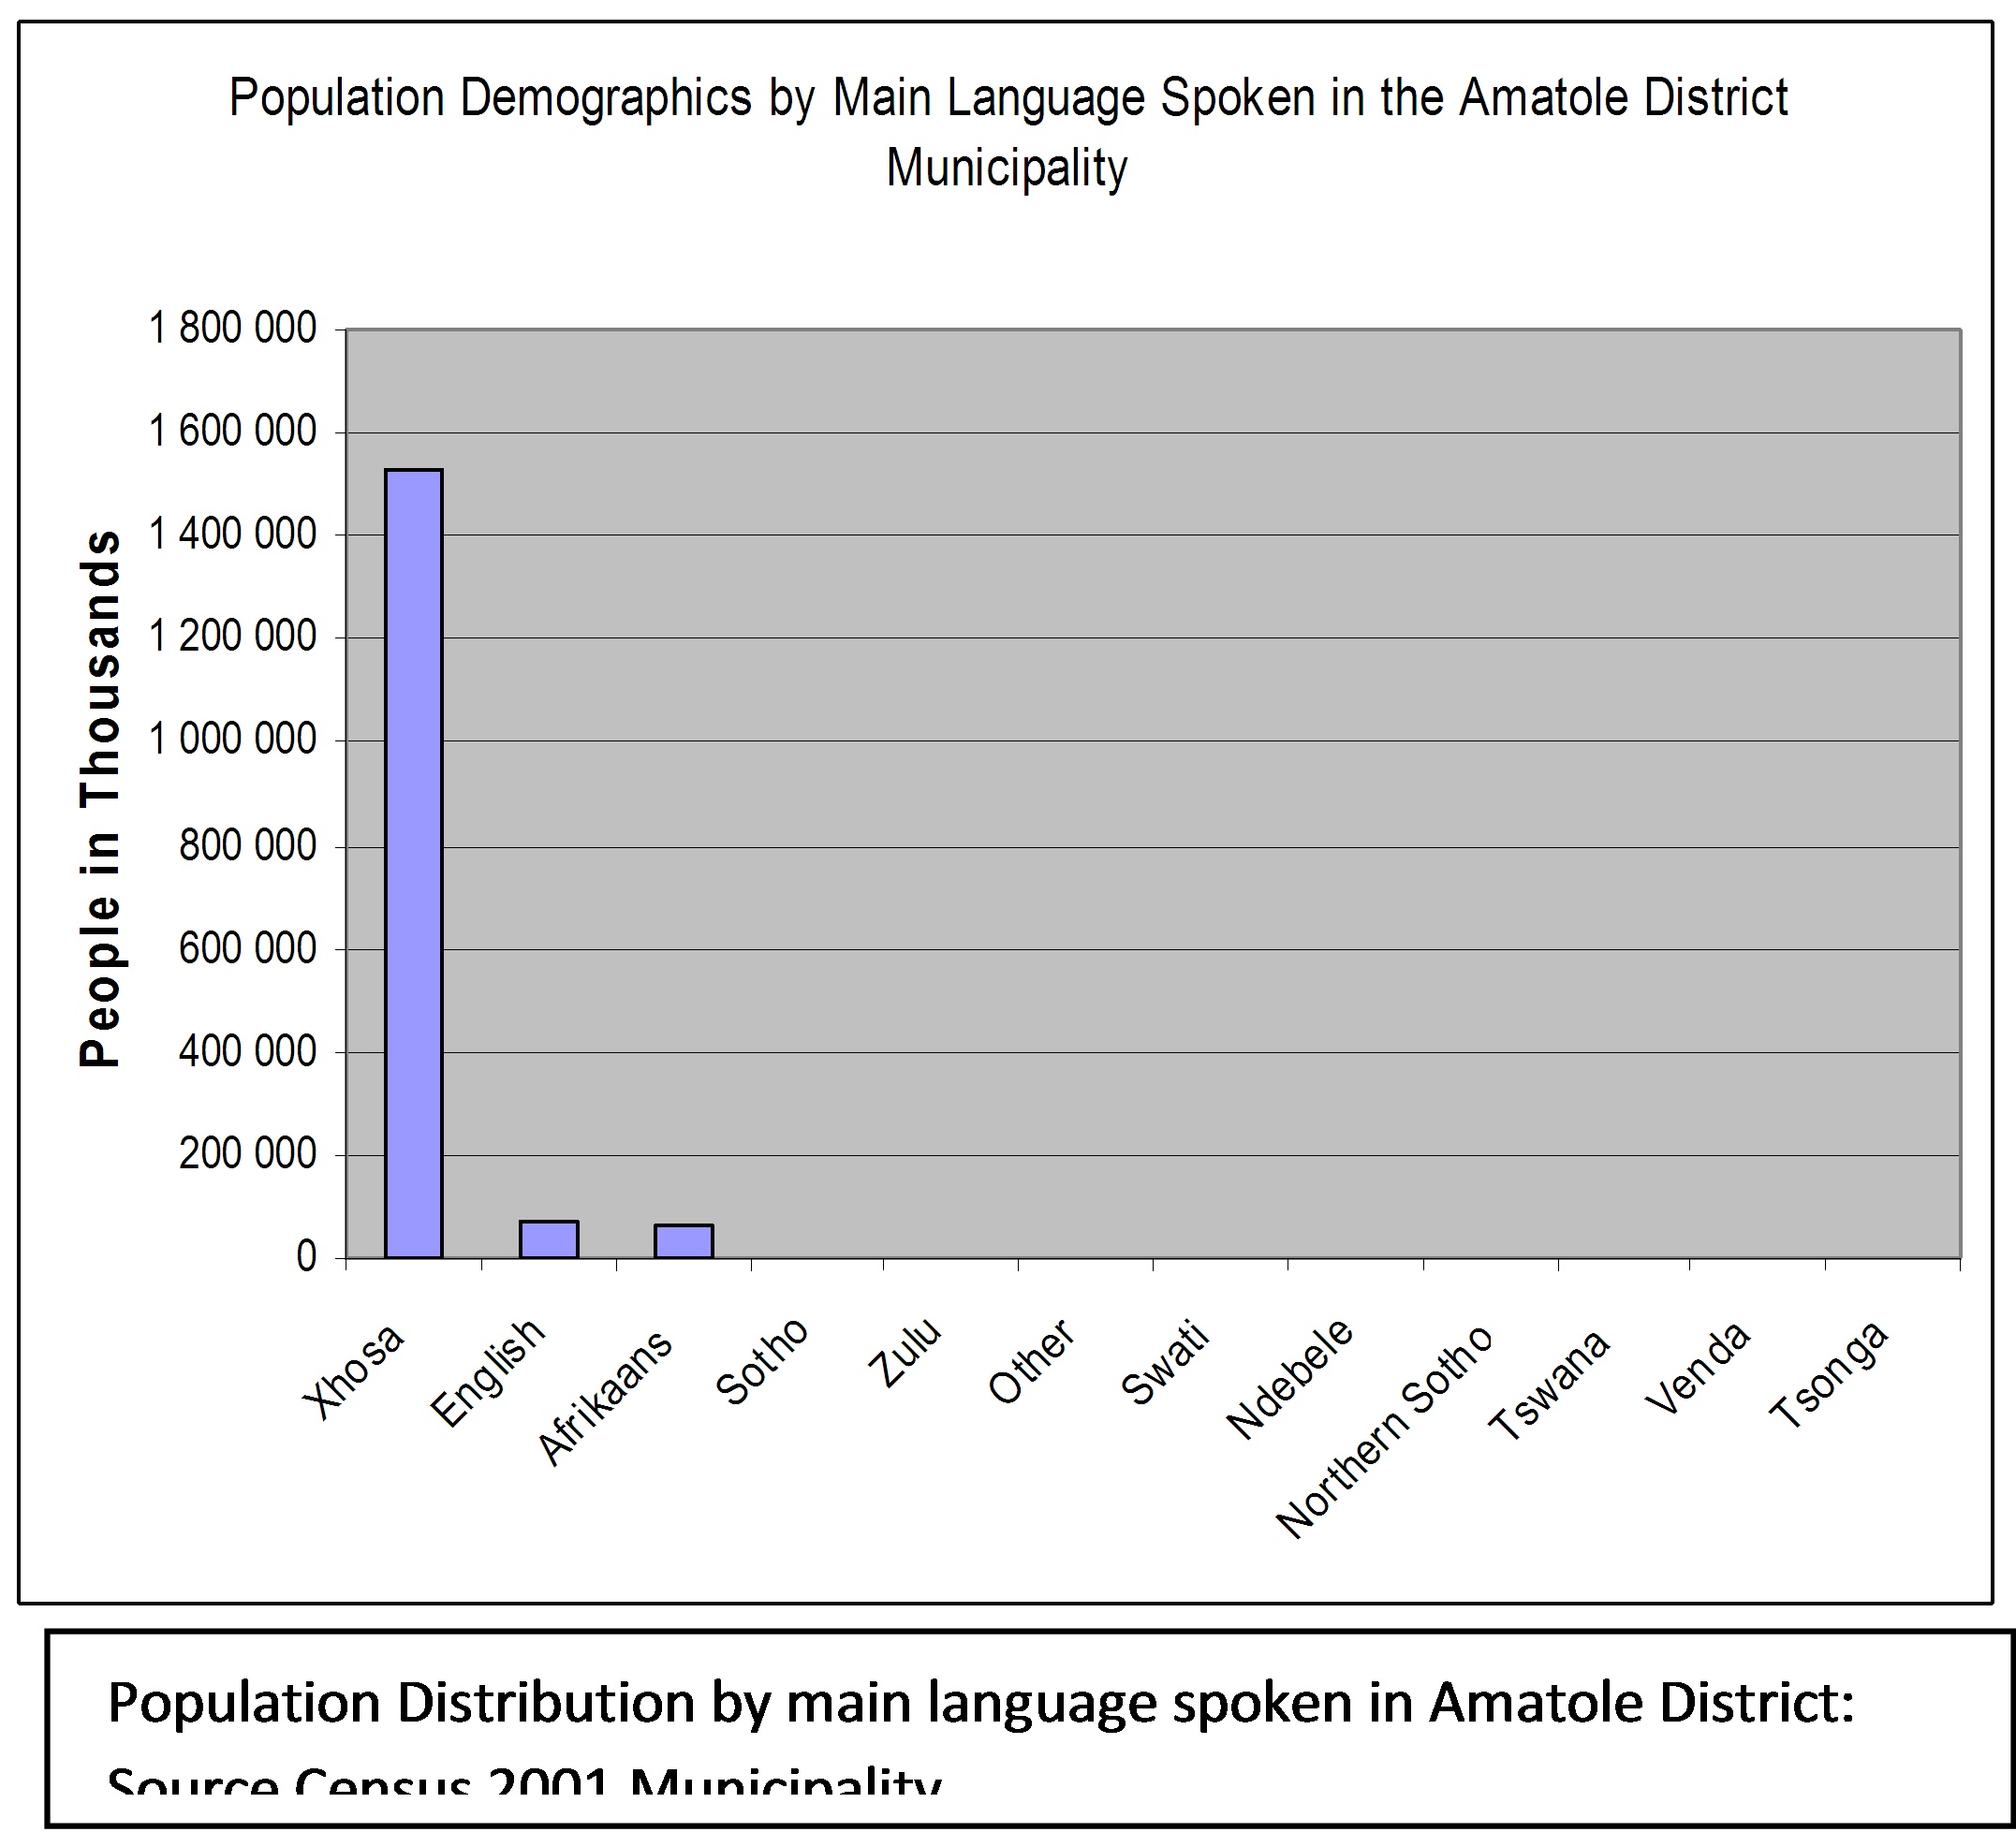
The district contains the following local municipalities: Buffalo City, Mnquma, Mbhashe, Amahlathi, Nkonkobe, Ngqushwa, Great Kei and Nxuba. Buffalo city has the highest population with a 42.17% component which is more than half the population size of the next municipality, i.e. Mnquma which stands at 17.29%. The smallest municipality is Nxuba which has 1.49% of the total population contribution. This picture resonates in the dominance of the district socio-economic and development landscape by Buffalo city. Freight Traffic volume and movement therefore tends to focus much more towards Buffalo city in the region as a hub and the other municipalities as feeders/spokes. Invariably the main route corridors that connect Buffalo city with the other municipalities experience heavy freight volumes than other routes. Transport policy freight policy and regulation measures interventions should be sensitive to such existing trends and unpack the impact and implications of such for the district and the Eastern Cape Province generally. Just like in Alfred Nzo District Municipality, in conducting freight business in the municipality the need to take account of the local languages for communication is important. The Figure to the left presents population distribution by language spoken in Amathole district. By the same token efforts for gender empowerment in freight and BBBEE are important given the gender and ethnic composition in the Amathole District Municipality.
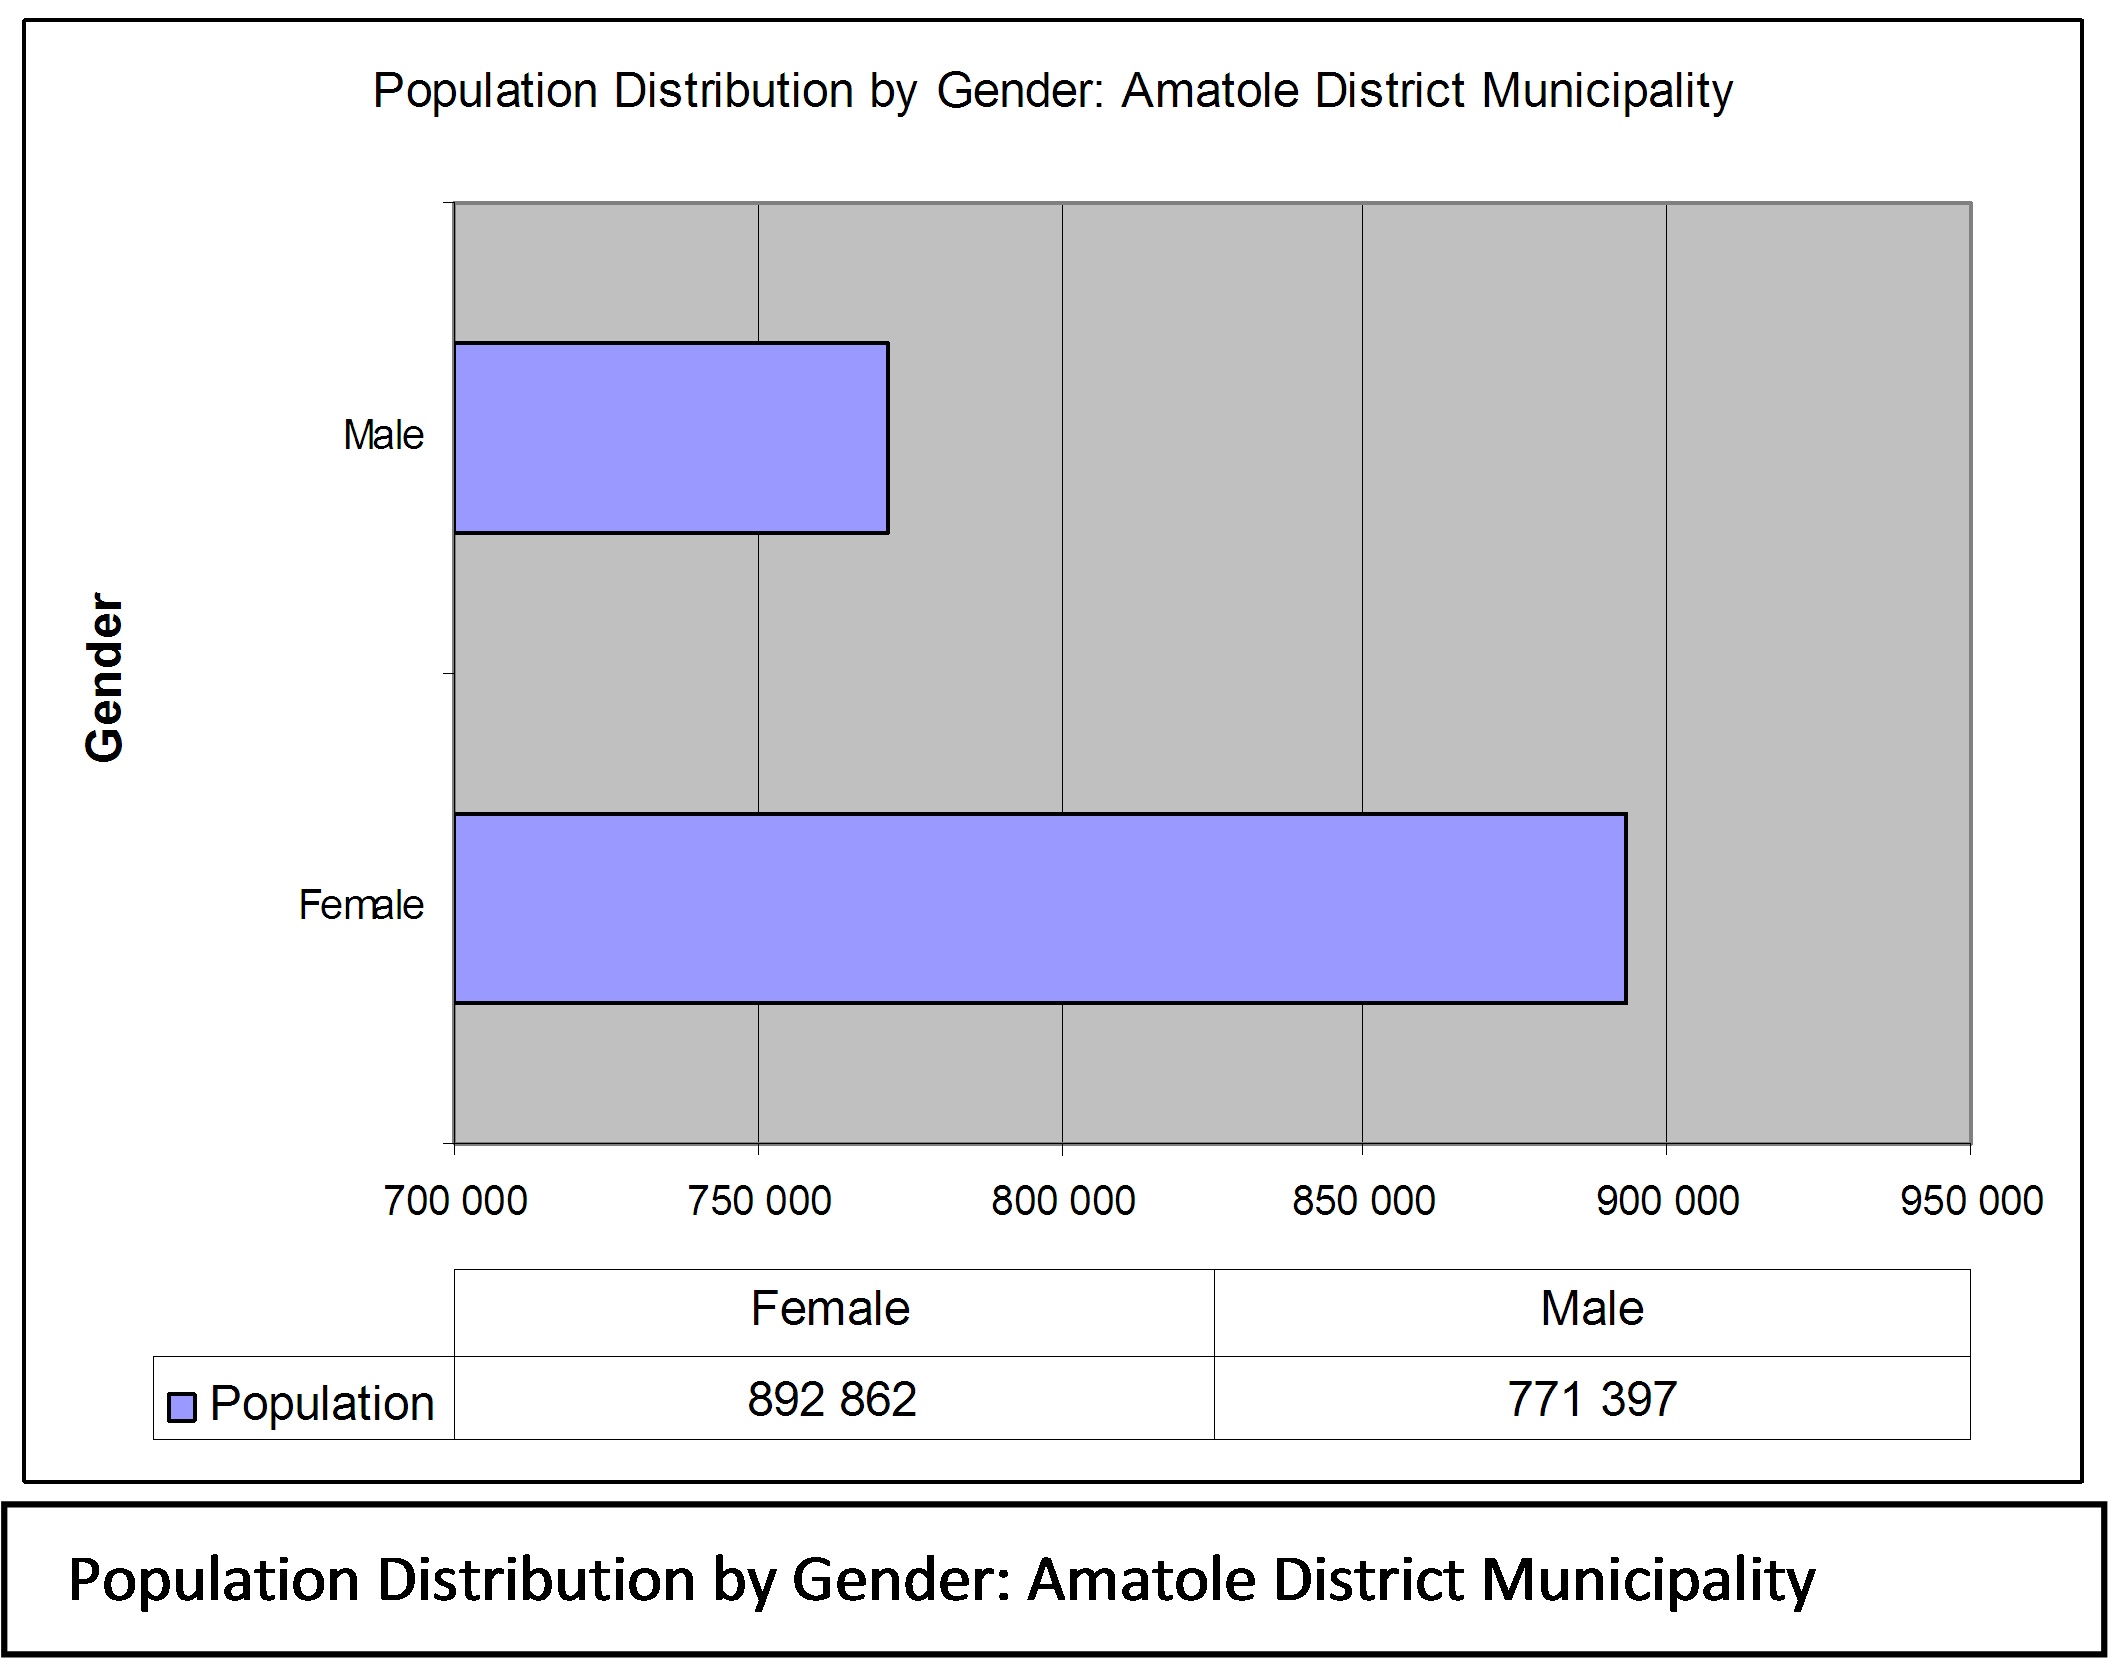
About a third of the Amathole population is younger than 15 years, while a relatively low 5, 6% is 65 years or older. Almost 60% of the District’s population is aged between 15 and 64. A high proportion of this group is economically active, possibly reflecting migration from rural to urban or semi-urban centres. The gender profile of the region is 47% male and 53% female (refer to figure to the right).
Levels of poverty are high and concentrated within the former Transkei and Ciskei local municipalities of Mbhashe (90.4%), Mnquma (80.2%) and Ngqushwa (87.4%) and lowest in Buffalo City (54.5%). The number and percentage of people living below the poverty line has increased significantly between 1996 and 2004 for the Eastern Cape, as a whole, and particularly for the poorer areas of Amathole. The percentage of people living below the poverty line is slightly lower in this District (68.5%) than for the Eastern Cape (69.3%) as a whole. The dramatic growth in poverty levels for the more desperate areas of Amathole is alarming in that the local municipal areas outside of Buffalo City report desperately high levels of poverty with increases of more than twenty percent in some instances.
In terms of the economic profile of the Amathole District, the area combines elements of a sophisticated and globalised automotive industrial economy with an under-developed agricultural sector, where household production levels are reportedly declining and where the majority of the population now depends on state pension and welfare as primary sources of subsistence. The District is consequently characterized by huge discrepancies in wealth and skills. The key sectors in the District (as defined by their contribution to GDP) include community or public sector service (27%), followed by manufacturing (25%), trade (15%) and lastly agriculture (3%). Community services contributed the most to employment (42%) followed by the manufacturing sector (18%) and then agriculture (13%). Tourism is also a significant contributor to GDP and employment in the District.
Tourism and Conservation
With regard to the environmental nature of the region, the Amathole District has many sensitive and conservation worthy areas within its region, such as the subtropical thicket, wetlands, river systems, cultural sites, rare and endangered species and of course its coastal areas. There are also many areas, which require remedial attention, i.e. the eradication of alien vegetation, erosion control and aspects that require special management, such as pollution and land use. This special and varied environment also presents many opportunities for the economic development of the area. Environmental degradation in the form of soil erosion, overgrazing and habitat destruction are key issues affecting the quality of the land, while over exploitation and lack of effective control are key issues with respect to marine resources within the tidal zone.
Settlement Patterns
An overall appraisal of the Amathole District indicates distinctive differences in the spatial patterns of development (i.e. settlement patterns) between the eight local municipalities. In general, it is evident that the urban complex of East London/King William’s Town (which falls within Buffalo City Municipality) dominates the District’s urban settlement pattern. Apart from this dominant urban centre, the District is characterised by a number of smaller towns (some of which function as sub-regional service centres), small coastal resort towns, so-called communal land areas where dispersed rural settlements are the dominant pattern, and areas where extensive commercial agricultural land holdings are the norm. The Provincial Spatial Development Plan motivates the categorization of settlement in the Province according to an analysis of central place indices, undertaken in the mid-1990s by the University of Potchefstroom, on commission by Statistics South Africa (SSA). Within this framework, three levels of settlement are identified in the PSDP, which correlate broadly to a strategic framework for investment in settlement.
With regard to the above strategic framework for investment in levels of settlement, a number of key implications for the management of settlement development are derived. These are: · There are five cities/towns within the Amathole District that are seen from a provincial perspective to be higher order urban areas where the highest levels of investment (level 3) could be targeted to achieve key development goals. These are identified as East London (Regional centre), Butterworth (Regional centre), King William’s Town (Regional centre), Stutterheim (District centre) and Alice (District centre); · In addition, six of the smaller towns in the District are identified in the ECPSDP for so-called level 2-type investment; that is investment to boost capacities of existing infrastructure or to extend institutional capacity for developmental purposes. These are identified as Fort Beaufort, Adelaide, Peddie, Dutywa, Bedford and Cathcart (all District centres - level 2); · In the strategic terms adopted by the ECPSDP, the remaining settlements within the Amathole District should be seen as areas that, in the first instance, should be regarded as level 1 settlements that need to achieve basic levels of services.
Road Network Infrastructure
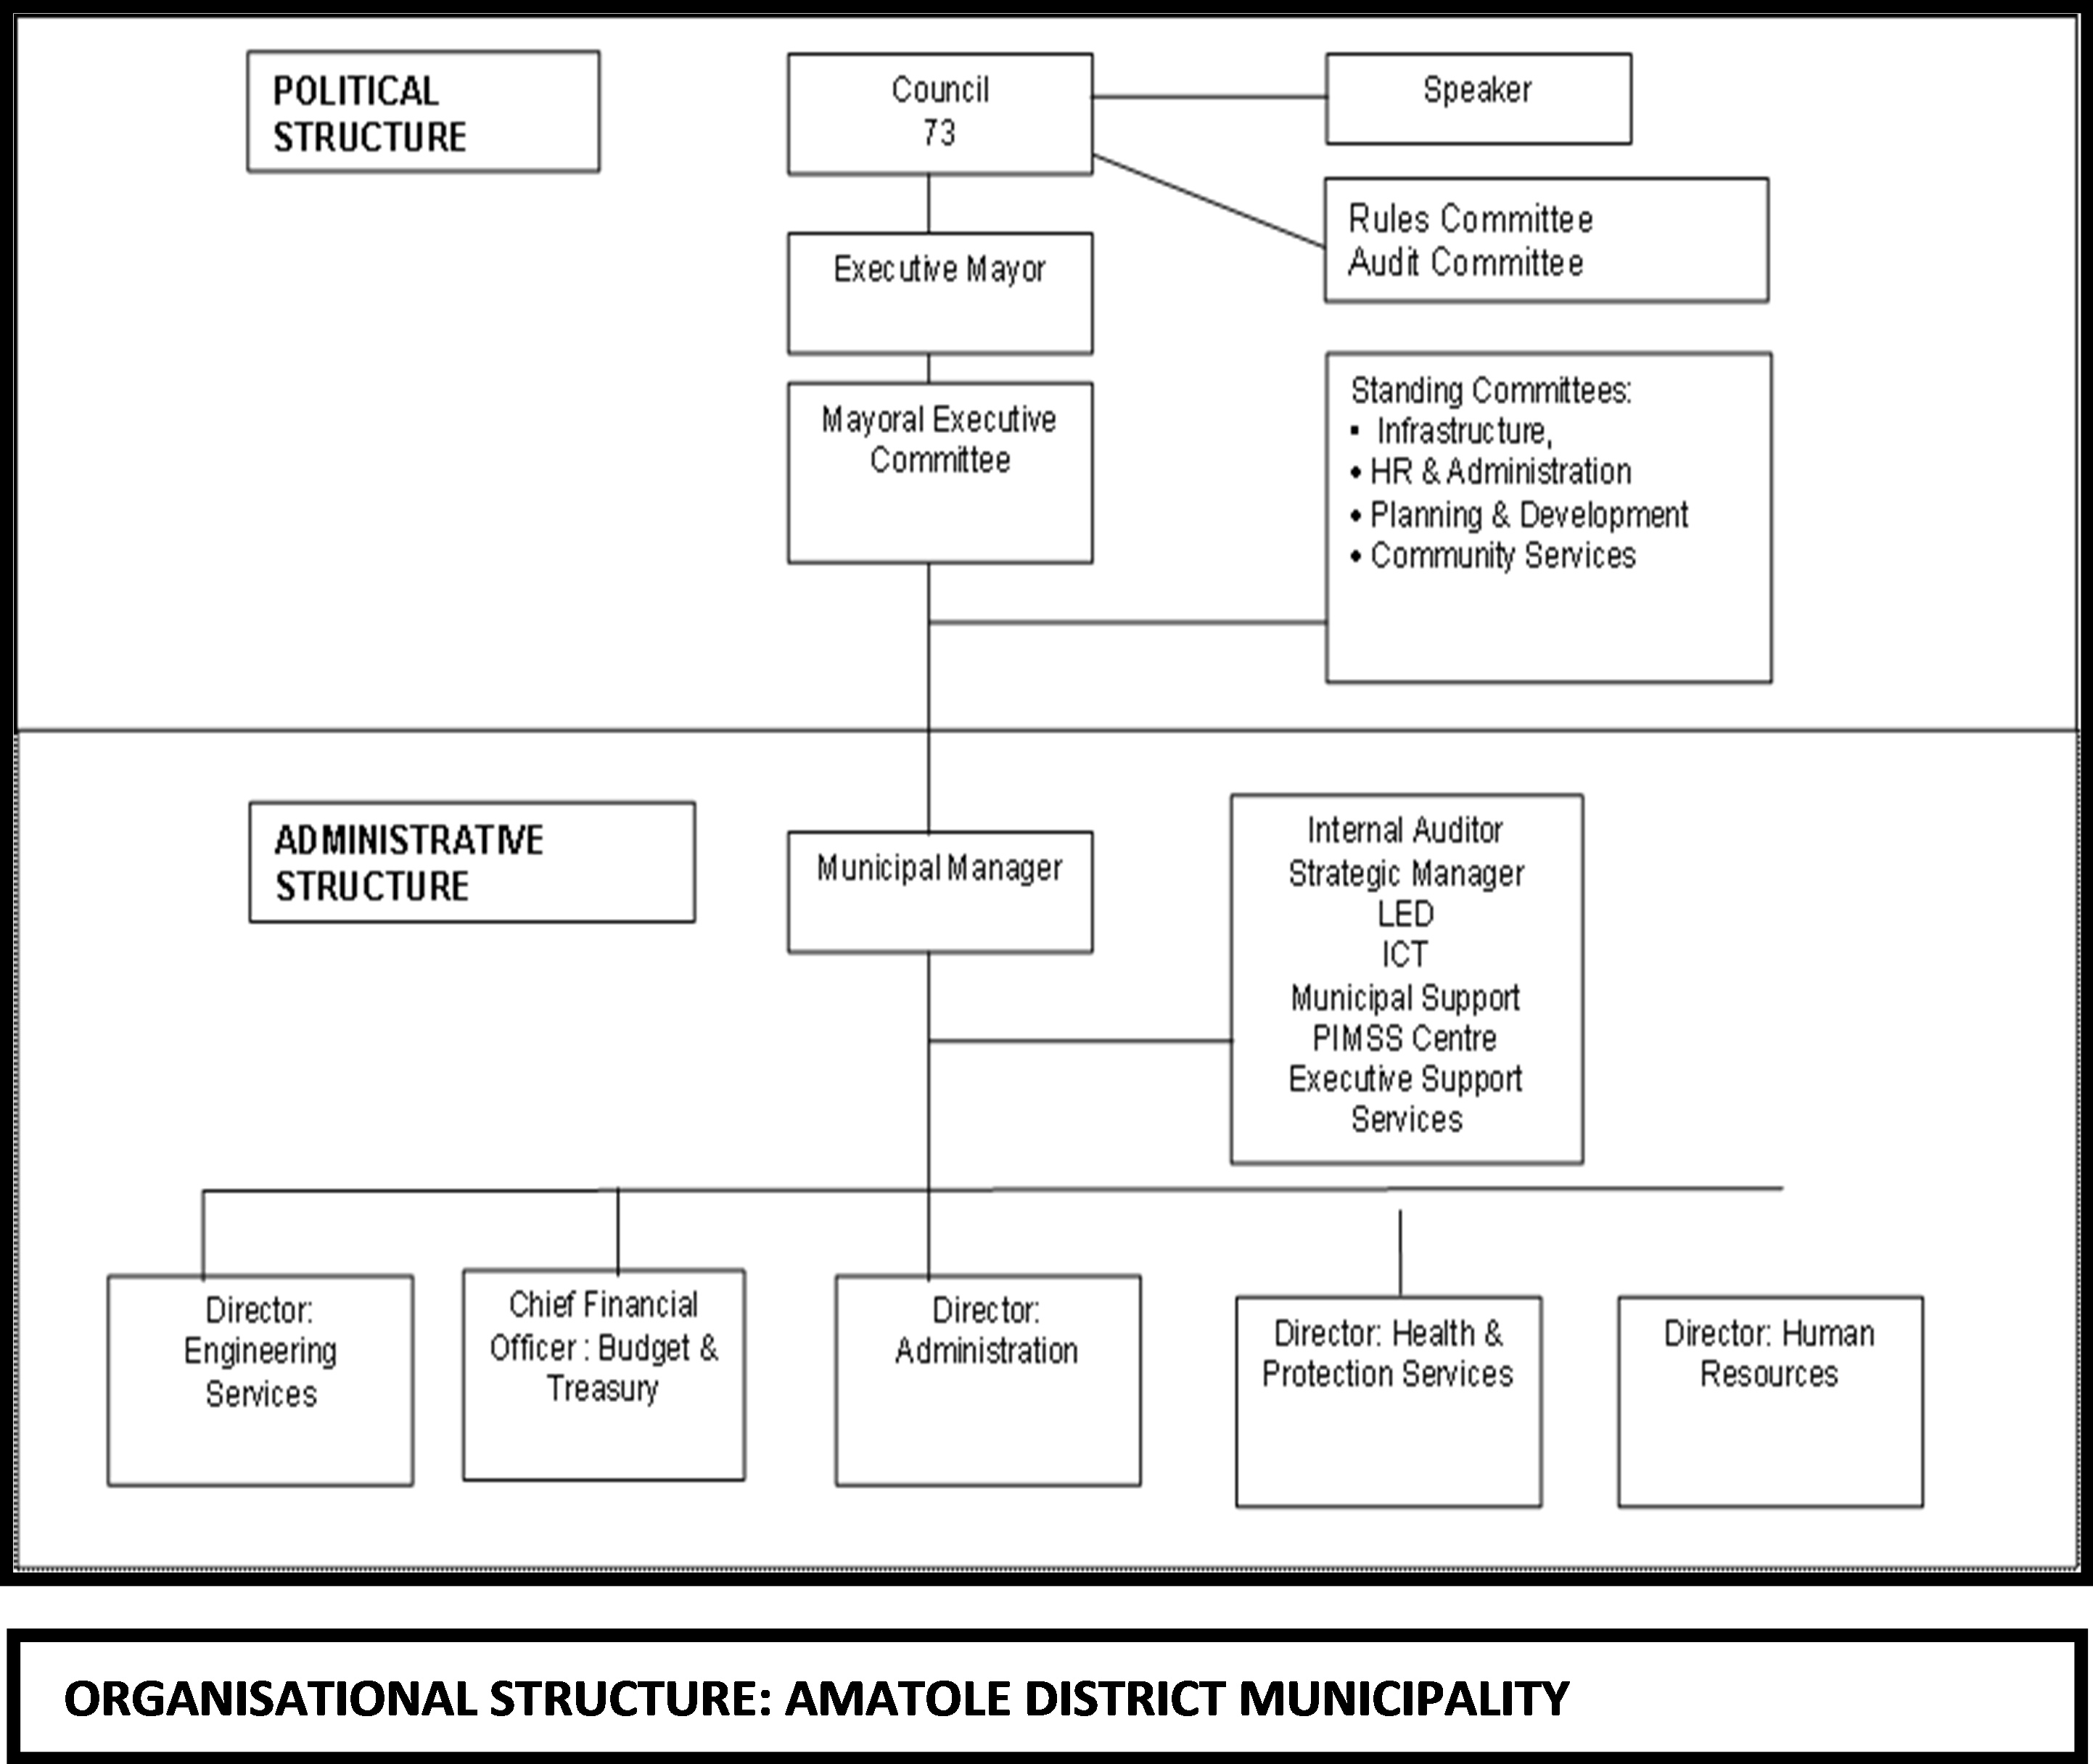
Organisational Structure of Amathole District
| |||||||||||||||||||||||||||||||||||||||||||||||||||||||||||||||||||||||||||||||||||||||||||||||||||||||||||||||||||||||||||||||||||||||||||||||||||||||||||||||||||||||||||||||||||||||||||||||||||